

66
L. Veelaert et al.
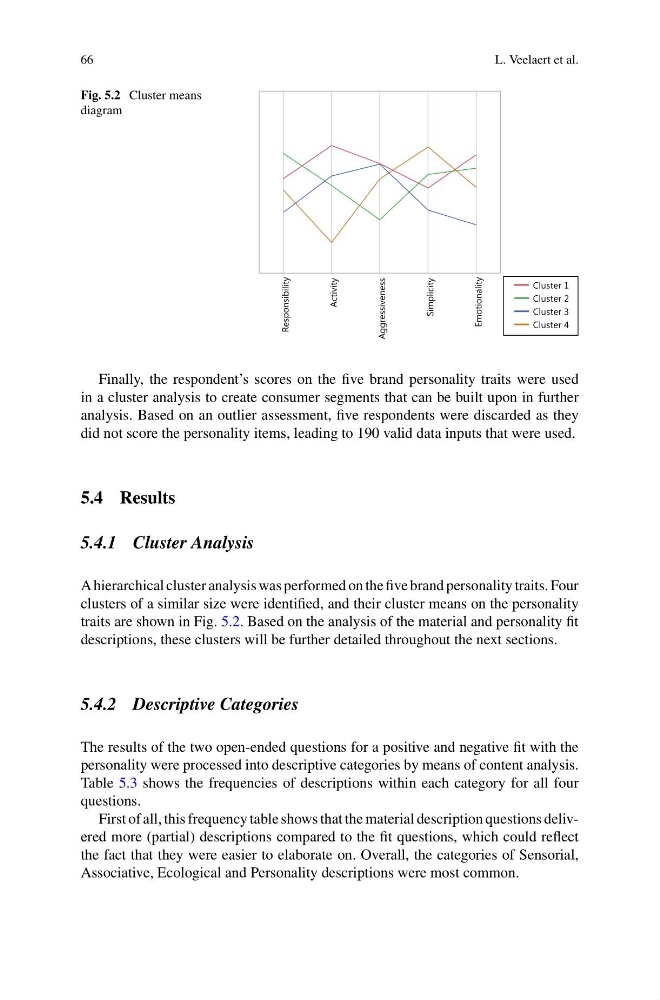
Fig. 5.2 Cluster means
diagram
Finally, the respondent’s scores on the five brand personality traits were used
in a cluster analysis to create consumer segments that can be built upon in further
analysis. Based on an outlier assessment, five respondents were discarded as they
did not score the personality items, leading to 190 valid data inputs that were used.
5.4 Results
5.4.1 Cluster Analysis
A hierarchical cluster analysis was performed on the five brand personality traits. Four
clusters of a similar size were identified, and their cluster means on the personality
traits are shown in Fig. 5.2. Based on the analysis of the material and personality fit
descriptions, these clusters will be further detailed throughout the next sections.
5.4.2 Descriptive Categories
The results of the two open-ended questions for a positive and negative fit with the
personality were processed into descriptive categories by means of content analysis.
Table 5.3 shows the frequencies of descriptions within each category for all four
questions.
First of all, this frequency table shows that the material description questions delivered more (partial) descriptions compared to the fit questions, which could reflect
the fact that they were easier to elaborate on. Overall, the categories of Sensorial,
Associative, Ecological and Personality descriptions were most common.
L. Veelaert et al.
Fig. 5.2 Cluster means
diagram
Finally, the respondent’s scores on the five brand personality traits were used
in a cluster analysis to create consumer segments that can be built upon in further
analysis. Based on an outlier assessment, five respondents were discarded as they
did not score the personality items, leading to 190 valid data inputs that were used.
5.4 Results
5.4.1 Cluster Analysis
A hierarchical cluster analysis was performed on the five brand personality traits. Four
clusters of a similar size were identified, and their cluster means on the personality
traits are shown in Fig. 5.2. Based on the analysis of the material and personality fit
descriptions, these clusters will be further detailed throughout the next sections.
5.4.2 Descriptive Categories
The results of the two open-ended questions for a positive and negative fit with the
personality were processed into descriptive categories by means of content analysis.
Table 5.3 shows the frequencies of descriptions within each category for all four
questions.
First of all, this frequency table shows that the material description questions delivered more (partial) descriptions compared to the fit questions, which could reflect
the fact that they were easier to elaborate on. Overall, the categories of Sensorial,
Associative, Ecological and Personality descriptions were most common.