

42 Dynamic Simulation of Woody Biomass Co-generation System …
641
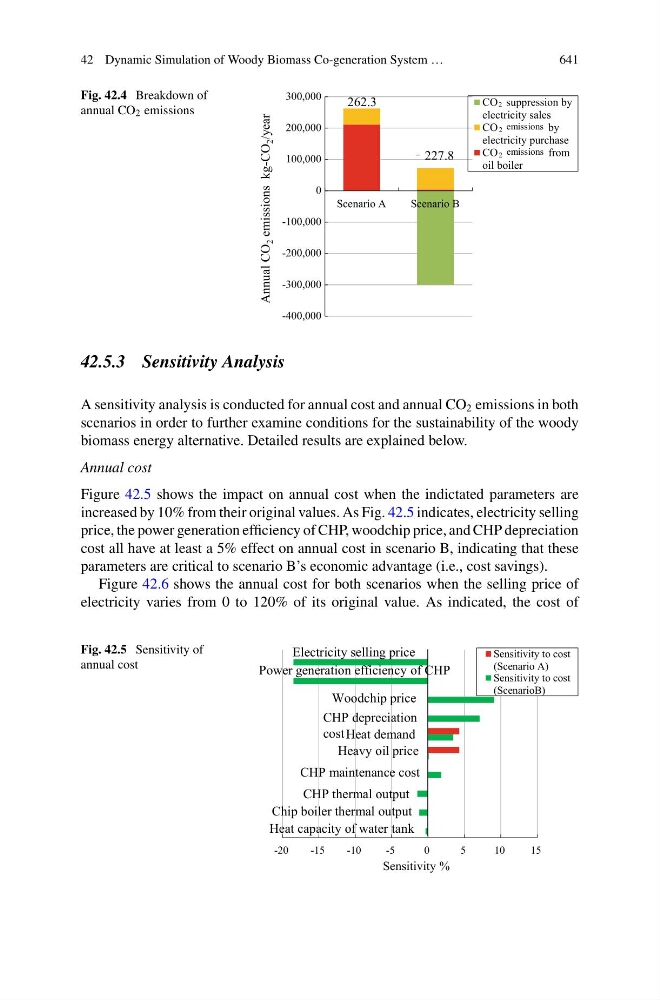
Fig. 42.4 Breakdown of
annual CO 2 emissions
Annual CO
2 emissions kg-CO
2 /year
-400,000
-300,000
-200,000
-100,000
0
100,000
200,000
300,000
Scenario A
Scenario B
CO2 suppression by
electricity sales
CO2 emission by
electricity purchase
CO2 emission from
oil boiler
262.3
227.8
2
2
2
emissions
emissions
42.5.3 Sensitivity Analysis
A sensitivity analysis is conducted for annual cost and annual CO 2 emissions in both
scenarios in order to further examine conditions for the sustainability of the woody
biomass energy alternative. Detailed results are explained below.
Annual cost
Figure 42.5 shows the impact on annual cost when the indictated parameters are
increased by 10% from their original values. As Fig. 42.5 indicates, electricity selling
price, the power generation efficiency of CHP, woodchip price, and CHP depreciation
cost all have at least a 5% effect on annual cost in scenario B, indicating that these
parameters are critical to scenario B’s economic advantage (i.e., cost savings).
Figure 42.6 shows the annual cost for both scenarios when the selling price of
electricity varies from 0 to 120% of its original value. As indicated, the cost of
Fig. 42.5 Sensitivity of
annual cost
-20
-15
-10
-5
0
5
10
15
Sensitivity to cost
(Scenario A)
Sensitivity to cost
(ScenarioB)
Sensitivity %
CHP depreciation
cost
Electricity selling price
Power generation efficiency of CHP
Woodchip price
Heavy oil price
CHP maintenance cost
CHP thermal output
Chip boiler thermal output
Heat capacity of water tank
Heat demand