

640
N. Nakatsuka et al.
Annual cost yen/year
-40,000,000
-30,000,000
-20,000,000
-10,000,000
0
10,000,000
20,000,000
30,000,000
40,000,000
50,000,000
Scenario A
Scenario B
Electricity sales
Electricity purchase
Peripheral maintenance
Peripheral depreciation
Oil boiler maintenance
Oil boiler depreciation
Chip boiler maintenance
Chip boiler depreciation
Gasification CHP maintenance
Gasification CHP depreciation
Heavy oil purchase
Chip boiler chip purchase
CHP chip purchase
17,064,469
13,224,802
31,001,400
electricity sales
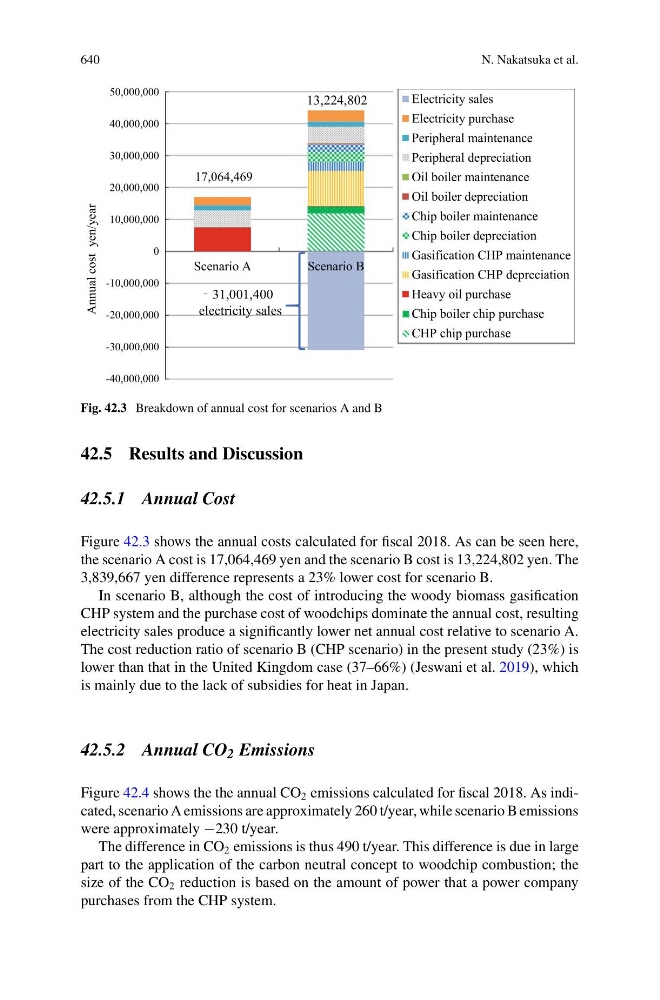
Fig. 42.3 Breakdown of annual cost for scenarios A and B
42.5 Results and Discussion
42.5.1 Annual Cost
Figure 42.3 shows the annual costs calculated for fiscal 2018. As can be seen here,
the scenario A cost is 17,064,469 yen and the scenario B cost is 13,224,802 yen. The
3,839,667 yen difference represents a 23% lower cost for scenario B.
In scenario B, although the cost of introducing the woody biomass gasification
CHP system and the purchase cost of woodchips dominate the annual cost, resulting
electricity sales produce a significantly lower net annual cost relative to scenario A.
The cost reduction ratio of scenario B (CHP scenario) in the present study (23%) is
lower than that in the United Kingdom case (37–66%) (Jeswani et al. 2019), which
is mainly due to the lack of subsidies for heat in Japan.
42.5.2 Annual CO 2 Emissions
Figure 42.4 shows the the annual CO 2 emissions calculated for fiscal 2018. As indicated, scenario A emissions are approximately 260 t/year, while scenario B emissions
were approximately −230 t/year.
The difference in CO 2 emissions is thus 490 t/year. This difference is due in large
part to the application of the carbon neutral concept to woodchip combustion; the
size of the CO 2 reduction is based on the amount of power that a power company
purchases from the CHP system.