

622
M. Chen et al.
used both day and night whenever electricity price is low, and other energy sources
such as natural gas, PV, oil, and hydro power are added only during the day time. From
this analysis, we concluded that from the perspective of solving the difficulty of solar
power expansion, P2G technology is beneficial. Because hydrogen can be generated
(using PVs and ECs) and consumed (using hydrogen co-firing) in different place
simultaneously, while batteries can only either charge or discharge, P2G technology
offers an advantage since it can use surplus power during the day time as well
(when electricity prices are higher). In this way, P2G enables communities to utilize
zero-cost surplus power.
41.3 Result
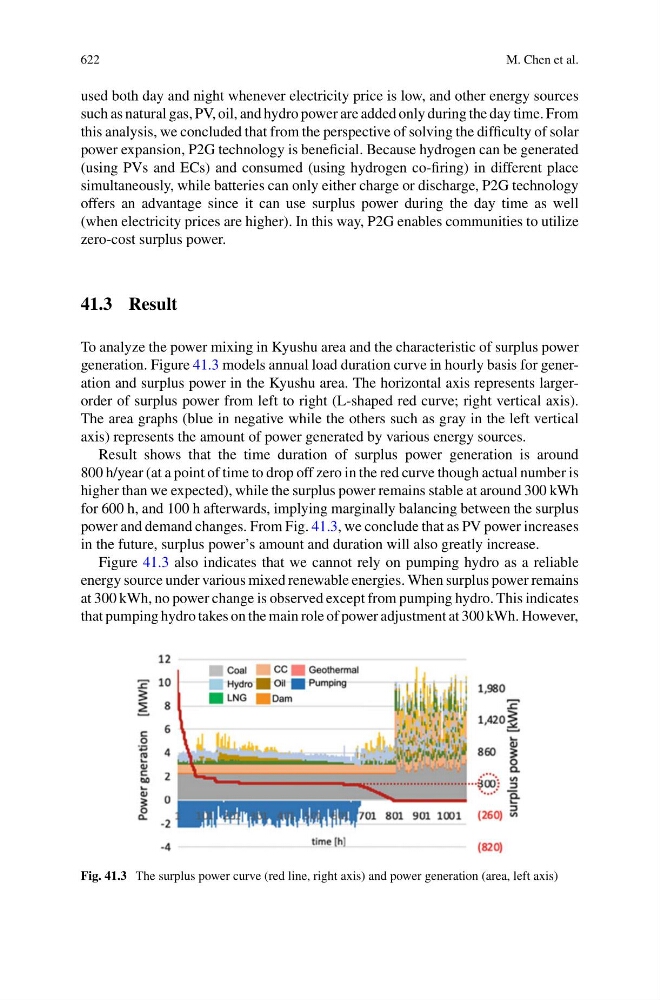
To analyze the power mixing in Kyushu area and the characteristic of surplus power
generation. Figure 41.3 models annual load duration curve in hourly basis for generation and surplus power in the Kyushu area. The horizontal axis represents largerorder of surplus power from left to right (L-shaped red curve; right vertical axis).
The area graphs (blue in negative while the others such as gray in the left vertical
axis) represents the amount of power generated by various energy sources.
Result shows that the time duration of surplus power generation is around
800 h/year (at a point of time to drop off zero in the red curve though actual number is
higher than we expected), while the surplus power remains stable at around 300 kWh
for 600 h, and 100 h afterwards, implying marginally balancing between the surplus
power and demand changes. From Fig. 41.3, we conclude that as PV power increases
in the future, surplus power’s amount and duration will also greatly increase.
Figure 41.3 also indicates that we cannot rely on pumping hydro as a reliable
energy source under various mixed renewable energies. When surplus power remains
at 300 kWh, no power change is observed except from pumping hydro. This indicates
that pumping hydro takes on the main role of power adjustment at 300 kWh. However,
Fig. 41.3 The surplus power curve (red line, right axis) and power generation (area, left axis)