

614
M. Huda et al.
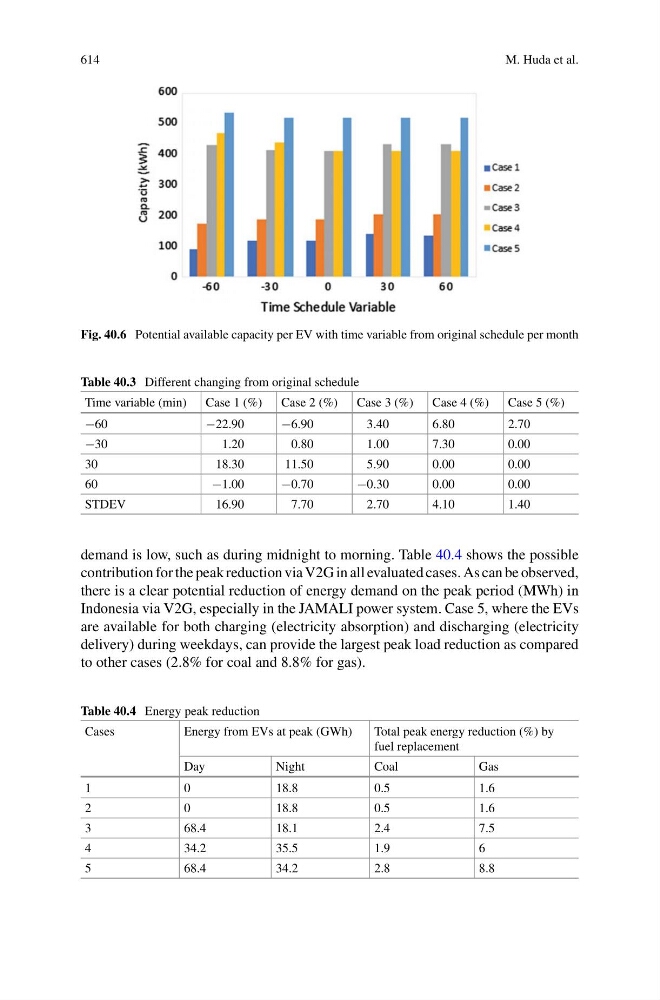
Fig. 40.6 Potential available capacity per EV with time variable from original schedule per month
Table 40.3 Different changing from original schedule
Time variable (min)
Case 1 (%)
Case 2 (%)
Case 3 (%)
Case 4 (%)
Case 5 (%)
−60
−22.90
−6.90
3.40
6.80
2.70
−30
1.20
0.80
1.00
7.30
0.00
30
18.30
11.50
5.90
0.00
0.00
60
−1.00
−0.70
−0.30
0.00
0.00
STDEV
16.90
7.70
2.70
4.10
1.40
demand is low, such as during midnight to morning. Table 40.4 shows the possible
contribution for the peak reduction via V2G in all evaluated cases. As can be observed,
there is a clear potential reduction of energy demand on the peak period (MWh) in
Indonesia via V2G, especially in the JAMALI power system. Case 5, where the EVs
are available for both charging (electricity absorption) and discharging (electricity
delivery) during weekdays, can provide the largest peak load reduction as compared
to other cases (2.8% for coal and 8.8% for gas).
Table 40.4 Energy peak reduction
Cases
Energy from EVs at peak (GWh)
Total peak energy reduction (%) by
fuel replacement
Day
Night
Coal
Gas
1
0
18.8
0.5
1.6
2
0
18.8
0.5
1.6
3
68.4
18.1
2.4
7.5
4
34.2
35.5
1.9
6
5
68.4
34.2
2.8
8.8