

552
I. Ihara et al.
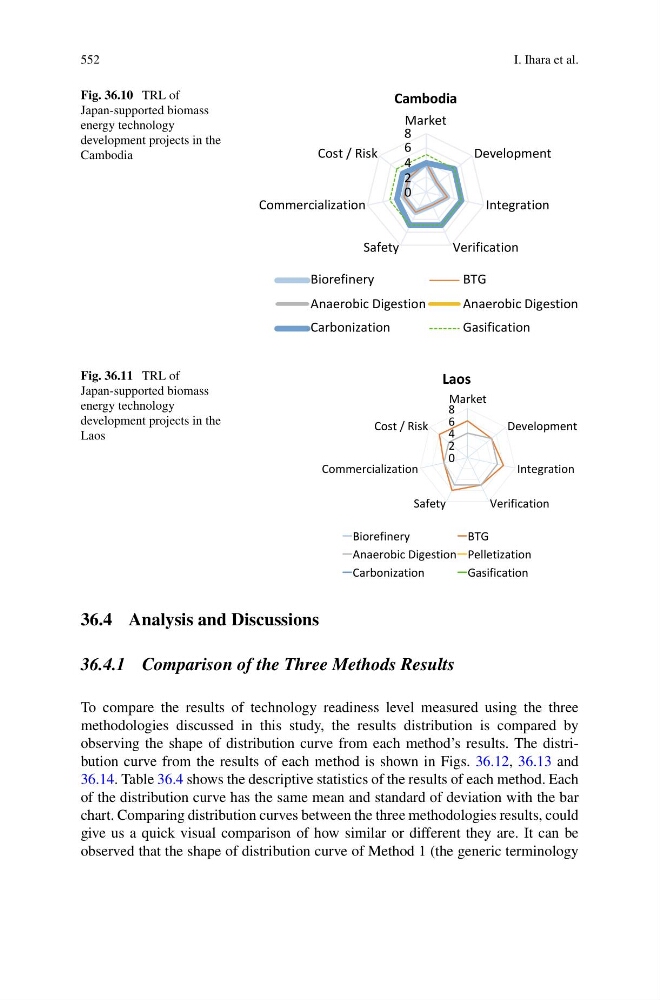
Fig. 36.10 TRL of
Japan-supported biomass
energy technology
development projects in the
Cambodia
0
2
4
6
8
Market
Development
Integration
Verification
Safety
Commercialization
Cost / Risk
Cambodia
Biorefinery
BTG
Anaerobic Digestion
Anaerobic Digestion
Carbonization
Gasification
Fig. 36.11 TRL of
Japan-supported biomass
energy technology
development projects in the
Laos
0
2
4
6
8
Market
Development
Integration
Verification
Safety
Commercialization
Cost / Risk
Laos
Biorefinery
BTG
Anaerobic Digestion Pelletization
Carbonization
Gasification
36.4 Analysis and Discussions
36.4.1 Comparison of the Three Methods Results
To compare the results of technology readiness level measured using the three
methodologies discussed in this study, the results distribution is compared by
observing the shape of distribution curve from each method’s results. The distribution curve from the results of each method is shown in Figs. 36.12, 36.13 and
36.14. Table 36.4 shows the descriptive statistics of the results of each method. Each
of the distribution curve has the same mean and standard of deviation with the bar
chart. Comparing distribution curves between the three methodologies results, could
give us a quick visual comparison of how similar or different they are. It can be
observed that the shape of distribution curve of Method 1 (the generic terminology
I. Ihara et al.
Fig. 36.10 TRL of
Japan-supported biomass
energy technology
development projects in the
Cambodia
0
2
4
6
8
Market
Development
Integration
Verification
Safety
Commercialization
Cost / Risk
Cambodia
Biorefinery
BTG
Anaerobic Digestion
Anaerobic Digestion
Carbonization
Gasification
Fig. 36.11 TRL of
Japan-supported biomass
energy technology
development projects in the
Laos
0
2
4
6
8
Market
Development
Integration
Verification
Safety
Commercialization
Cost / Risk
Laos
Biorefinery
BTG
Anaerobic Digestion Pelletization
Carbonization
Gasification
36.4 Analysis and Discussions
36.4.1 Comparison of the Three Methods Results
To compare the results of technology readiness level measured using the three
methodologies discussed in this study, the results distribution is compared by
observing the shape of distribution curve from each method’s results. The distribution curve from the results of each method is shown in Figs. 36.12, 36.13 and
36.14. Table 36.4 shows the descriptive statistics of the results of each method. Each
of the distribution curve has the same mean and standard of deviation with the bar
chart. Comparing distribution curves between the three methodologies results, could
give us a quick visual comparison of how similar or different they are. It can be
observed that the shape of distribution curve of Method 1 (the generic terminology