

424
T. Hishinuma et al.
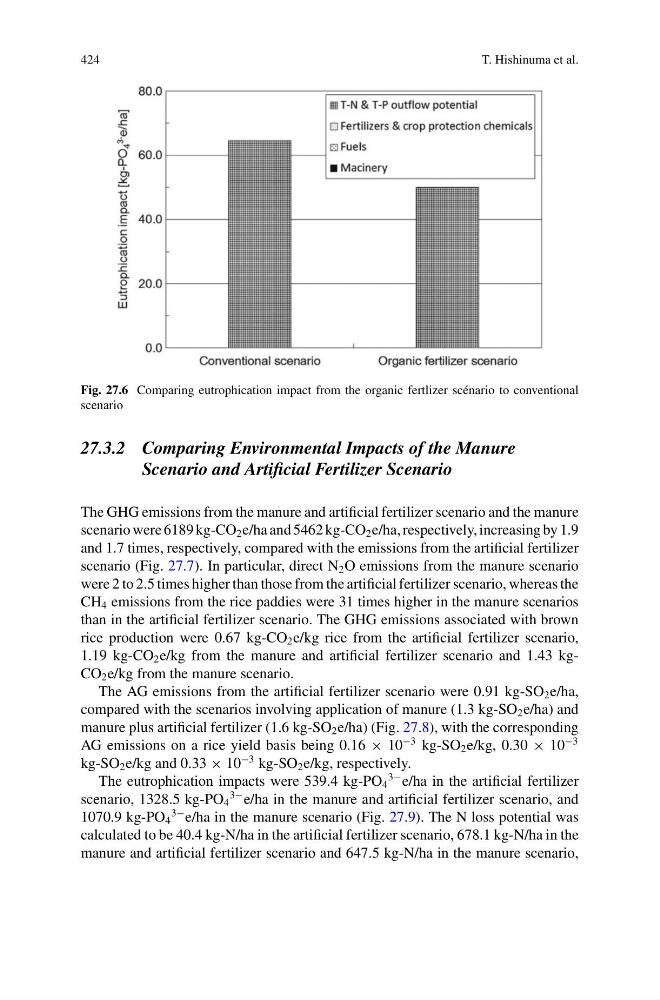
Fig. 27.6 Comparing eutrophication impact from the organic fertlizer scénario to conventional
scenario
27.3.2 Comparing Environmental Impacts of the Manure
Scenario and Artificial Fertilizer Scenario
The GHG emissions from the manure and artificial fertilizer scenario and the manure
scenario were 6189 kg-CO 2 e/ha and 5462 kg-CO 2 e/ha, respectively, increasing by 1.9
and 1.7 times, respectively, compared with the emissions from the artificial fertilizer
scenario (Fig. 27.7). In particular, direct N 2 O emissions from the manure scenario
were 2 to 2.5 times higher than those from the artificial fertilizer scenario, whereas the
CH 4 emissions from the rice paddies were 31 times higher in the manure scenarios
than in the artificial fertilizer scenario. The GHG emissions associated with brown
rice production were 0.67 kg-CO 2 e/kg rice from the artificial fertilizer scenario,
1.19 kg-CO 2 e/kg from the manure and artificial fertilizer scenario and 1.43 kgCO 2 e/kg from the manure scenario.
The AG emissions from the artificial fertilizer scenario were 0.91 kg-SO 2 e/ha,
compared with the scenarios involving application of manure (1.3 kg-SO 2 e/ha) and
manure plus artificial fertilizer (1.6 kg-SO 2 e/ha) (Fig. 27.8), with the corresponding
AG emissions on a rice yield basis being 0.16 × 10
−3 kg-SO 2 e/kg, 0.30 × 10
−3
kg-SO 2 e/kg and 0.33 × 10
−3 kg-SO 2 e/kg, respectively.
The eutrophication impacts were 539.4 kg-PO 4
3− e/ha in the artificial fertilizer
scenario, 1328.5 kg-PO 4
3− e/ha in the manure and artificial fertilizer scenario, and
1070.9 kg-PO 4
3− e/ha in the manure scenario (Fig. 27.9). The N loss potential was
calculated to be 40.4 kg-N/ha in the artificial fertilizer scenario, 678.1 kg-N/ha in the
manure and artificial fertilizer scenario and 647.5 kg-N/ha in the manure scenario,
T. Hishinuma et al.
Fig. 27.6 Comparing eutrophication impact from the organic fertlizer scénario to conventional
scenario
27.3.2 Comparing Environmental Impacts of the Manure
Scenario and Artificial Fertilizer Scenario
The GHG emissions from the manure and artificial fertilizer scenario and the manure
scenario were 6189 kg-CO 2 e/ha and 5462 kg-CO 2 e/ha, respectively, increasing by 1.9
and 1.7 times, respectively, compared with the emissions from the artificial fertilizer
scenario (Fig. 27.7). In particular, direct N 2 O emissions from the manure scenario
were 2 to 2.5 times higher than those from the artificial fertilizer scenario, whereas the
CH 4 emissions from the rice paddies were 31 times higher in the manure scenarios
than in the artificial fertilizer scenario. The GHG emissions associated with brown
rice production were 0.67 kg-CO 2 e/kg rice from the artificial fertilizer scenario,
1.19 kg-CO 2 e/kg from the manure and artificial fertilizer scenario and 1.43 kgCO 2 e/kg from the manure scenario.
The AG emissions from the artificial fertilizer scenario were 0.91 kg-SO 2 e/ha,
compared with the scenarios involving application of manure (1.3 kg-SO 2 e/ha) and
manure plus artificial fertilizer (1.6 kg-SO 2 e/ha) (Fig. 27.8), with the corresponding
AG emissions on a rice yield basis being 0.16 × 10
−3 kg-SO 2 e/kg, 0.30 × 10
−3
kg-SO 2 e/kg and 0.33 × 10
−3 kg-SO 2 e/kg, respectively.
The eutrophication impacts were 539.4 kg-PO 4
3− e/ha in the artificial fertilizer
scenario, 1328.5 kg-PO 4
3− e/ha in the manure and artificial fertilizer scenario, and
1070.9 kg-PO 4
3− e/ha in the manure scenario (Fig. 27.9). The N loss potential was
calculated to be 40.4 kg-N/ha in the artificial fertilizer scenario, 678.1 kg-N/ha in the
manure and artificial fertilizer scenario and 647.5 kg-N/ha in the manure scenario,