

418
T. Hishinuma et al.
27.2.2 Process Model of Paddy Rice Farming System
The process model and system boundary analyzed in this study are shown in Fig. 27.2.
The process model assumes a system of family farming, operated around 20 ha
of rice paddies including contract paddy farming, using medium-type-operation
machinery, a 60 PS tractor, a six-row rice transplanting machine and a four-row
combine harvester. In Japan, the expansion of rice paddy production scale by local
core farmers used rice paddies from small-scale farmers or retired farmers to achieve
the effective operation size for rice paddy production. The process model reflects
the case of the local core farmer contracting paddy rice farmland from neighboring
small-scale farmers.
27.2.3 Estimation of Potential Nitrogen and Phosphorus
Loss, Using FGB
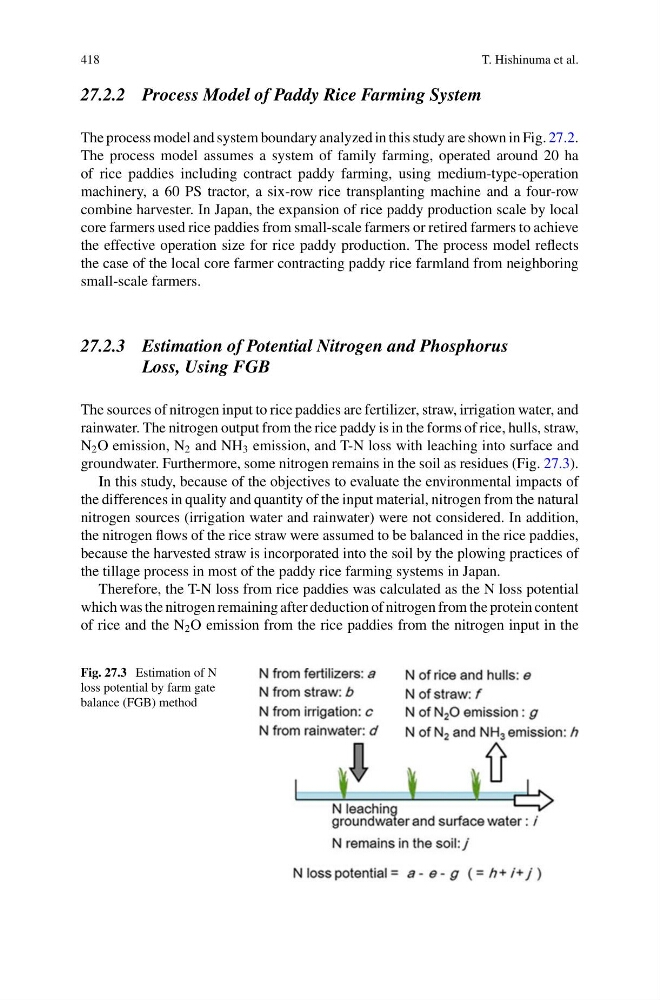
The sources of nitrogen input to rice paddies are fertilizer, straw, irrigation water, and
rainwater. The nitrogen output from the rice paddy is in the forms of rice, hulls, straw,
N 2 O emission, N 2 and NH 3 emission, and T-N loss with leaching into surface and
groundwater. Furthermore, some nitrogen remains in the soil as residues (Fig. 27.3).
In this study, because of the objectives to evaluate the environmental impacts of
the differences in quality and quantity of the input material, nitrogen from the natural
nitrogen sources (irrigation water and rainwater) were not considered. In addition,
the nitrogen flows of the rice straw were assumed to be balanced in the rice paddies,
because the harvested straw is incorporated into the soil by the plowing practices of
the tillage process in most of the paddy rice farming systems in Japan.
Therefore, the T-N loss from rice paddies was calculated as the N loss potential
which was the nitrogen remaining after deduction of nitrogen from the protein content
of rice and the N 2 O emission from the rice paddies from the nitrogen input in the
Fig. 27.3 Estimation of N
loss potential by farm gate
balance (FGB) method
T. Hishinuma et al.
27.2.2 Process Model of Paddy Rice Farming System
The process model and system boundary analyzed in this study are shown in Fig. 27.2.
The process model assumes a system of family farming, operated around 20 ha
of rice paddies including contract paddy farming, using medium-type-operation
machinery, a 60 PS tractor, a six-row rice transplanting machine and a four-row
combine harvester. In Japan, the expansion of rice paddy production scale by local
core farmers used rice paddies from small-scale farmers or retired farmers to achieve
the effective operation size for rice paddy production. The process model reflects
the case of the local core farmer contracting paddy rice farmland from neighboring
small-scale farmers.
27.2.3 Estimation of Potential Nitrogen and Phosphorus
Loss, Using FGB
The sources of nitrogen input to rice paddies are fertilizer, straw, irrigation water, and
rainwater. The nitrogen output from the rice paddy is in the forms of rice, hulls, straw,
N 2 O emission, N 2 and NH 3 emission, and T-N loss with leaching into surface and
groundwater. Furthermore, some nitrogen remains in the soil as residues (Fig. 27.3).
In this study, because of the objectives to evaluate the environmental impacts of
the differences in quality and quantity of the input material, nitrogen from the natural
nitrogen sources (irrigation water and rainwater) were not considered. In addition,
the nitrogen flows of the rice straw were assumed to be balanced in the rice paddies,
because the harvested straw is incorporated into the soil by the plowing practices of
the tillage process in most of the paddy rice farming systems in Japan.
Therefore, the T-N loss from rice paddies was calculated as the N loss potential
which was the nitrogen remaining after deduction of nitrogen from the protein content
of rice and the N 2 O emission from the rice paddies from the nitrogen input in the
Fig. 27.3 Estimation of N
loss potential by farm gate
balance (FGB) method