

26 Ecological Cost-Benefit Analysis of a Sensor-Based Parking …
409
any guidance. This principle approaches that low probability of finding a parking
space leads to a covered longer distance and therefore, more emissions are emitted.
In the city of Hamburg, the average yearly search time for parking lots is 52 h per
driver (Cookson and Pishue 2017). Hence, assuming an average speed of approx.
30 km/h, the daily search attempt is around 1,200 m within an 8.5-minute-long drive.
This nearly fits the probability model value of 33% probability of success without
“Park&Joy” application and is considered as a confirmation for the model. However,
the total driving distance is a rough assumption contributing a rapid model creation
with the opportunity of improvement in the data base after additional information
from the “Park&Joy” system is available.
26.4.2 Emission Saving Calculation
With the GWP of the server infrastructure, the sensors and the probability model of
parking attempts, it is possible to calculate cost, benefit, amortization and the emission balance. For the city of Hamburg, the whole infrastructure for “Park&Joy” costs
around 17t CO 2 eq per year. This result includes the manufacturing of all necessary
server proportionate per year, the usage of all server per year and the manufacturing,
rollout and usage of all sensors proportionate per year in depending overall hardware
lifetime. If every parking process in the city is performed with “Park&Joy” guidance
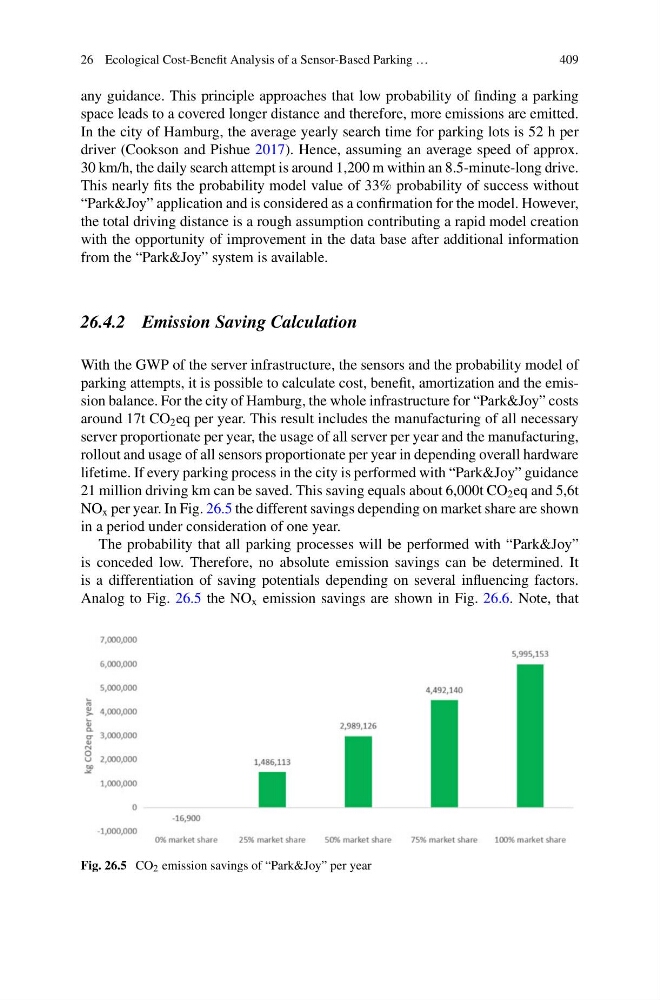
21 million driving km can be saved. This saving equals about 6,000t CO 2 eq and 5,6t
NO x per year. In Fig. 26.5 the different savings depending on market share are shown
in a period under consideration of one year.
The probability that all parking processes will be performed with “Park&Joy”
is conceded low. Therefore, no absolute emission savings can be determined. It
is a differentiation of saving potentials depending on several influencing factors.
Analog to Fig. 26.5 the NO x emission savings are shown in Fig. 26.6. Note, that
Fig. 26.5 CO 2 emission savings of “Park&Joy” per year
409
any guidance. This principle approaches that low probability of finding a parking
space leads to a covered longer distance and therefore, more emissions are emitted.
In the city of Hamburg, the average yearly search time for parking lots is 52 h per
driver (Cookson and Pishue 2017). Hence, assuming an average speed of approx.
30 km/h, the daily search attempt is around 1,200 m within an 8.5-minute-long drive.
This nearly fits the probability model value of 33% probability of success without
“Park&Joy” application and is considered as a confirmation for the model. However,
the total driving distance is a rough assumption contributing a rapid model creation
with the opportunity of improvement in the data base after additional information
from the “Park&Joy” system is available.
26.4.2 Emission Saving Calculation
With the GWP of the server infrastructure, the sensors and the probability model of
parking attempts, it is possible to calculate cost, benefit, amortization and the emission balance. For the city of Hamburg, the whole infrastructure for “Park&Joy” costs
around 17t CO 2 eq per year. This result includes the manufacturing of all necessary
server proportionate per year, the usage of all server per year and the manufacturing,
rollout and usage of all sensors proportionate per year in depending overall hardware
lifetime. If every parking process in the city is performed with “Park&Joy” guidance
21 million driving km can be saved. This saving equals about 6,000t CO 2 eq and 5,6t
NO x per year. In Fig. 26.5 the different savings depending on market share are shown
in a period under consideration of one year.
The probability that all parking processes will be performed with “Park&Joy”
is conceded low. Therefore, no absolute emission savings can be determined. It
is a differentiation of saving potentials depending on several influencing factors.
Analog to Fig. 26.5 the NO x emission savings are shown in Fig. 26.6. Note, that
Fig. 26.5 CO 2 emission savings of “Park&Joy” per year