

218
X. Zhang et al.
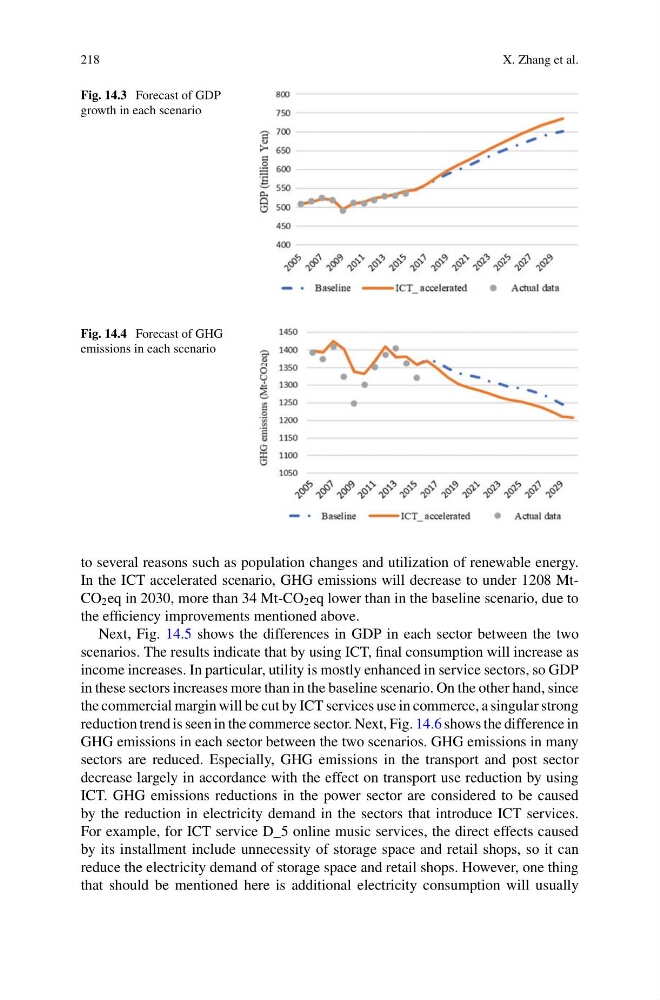
Fig. 14.3 Forecast of GDP
growth in each scenario
Fig. 14.4 Forecast of GHG
emissions in each scenario
to several reasons such as population changes and utilization of renewable energy.
In the ICT accelerated scenario, GHG emissions will decrease to under 1208 MtCO 2 eq in 2030, more than 34 Mt-CO 2 eq lower than in the baseline scenario, due to
the efficiency improvements mentioned above.
Next, Fig. 14.5 shows the differences in GDP in each sector between the two
scenarios. The results indicate that by using ICT, final consumption will increase as
income increases. In particular, utility is mostly enhanced in service sectors, so GDP
in these sectors increases more than in the baseline scenario. On the other hand, since
the commercial margin will be cut by ICT services use in commerce, a singular strong
reduction trend is seen in the commerce sector. Next, Fig. 14.6 shows the difference in
GHG emissions in each sector between the two scenarios. GHG emissions in many
sectors are reduced. Especially, GHG emissions in the transport and post sector
decrease largely in accordance with the effect on transport use reduction by using
ICT. GHG emissions reductions in the power sector are considered to be caused
by the reduction in electricity demand in the sectors that introduce ICT services.
For example, for ICT service D_5 online music services, the direct effects caused
by its installment include unnecessity of storage space and retail shops, so it can
reduce the electricity demand of storage space and retail shops. However, one thing
that should be mentioned here is additional electricity consumption will usually
X. Zhang et al.
Fig. 14.3 Forecast of GDP
growth in each scenario
Fig. 14.4 Forecast of GHG
emissions in each scenario
to several reasons such as population changes and utilization of renewable energy.
In the ICT accelerated scenario, GHG emissions will decrease to under 1208 MtCO 2 eq in 2030, more than 34 Mt-CO 2 eq lower than in the baseline scenario, due to
the efficiency improvements mentioned above.
Next, Fig. 14.5 shows the differences in GDP in each sector between the two
scenarios. The results indicate that by using ICT, final consumption will increase as
income increases. In particular, utility is mostly enhanced in service sectors, so GDP
in these sectors increases more than in the baseline scenario. On the other hand, since
the commercial margin will be cut by ICT services use in commerce, a singular strong
reduction trend is seen in the commerce sector. Next, Fig. 14.6 shows the difference in
GHG emissions in each sector between the two scenarios. GHG emissions in many
sectors are reduced. Especially, GHG emissions in the transport and post sector
decrease largely in accordance with the effect on transport use reduction by using
ICT. GHG emissions reductions in the power sector are considered to be caused
by the reduction in electricity demand in the sectors that introduce ICT services.
For example, for ICT service D_5 online music services, the direct effects caused
by its installment include unnecessity of storage space and retail shops, so it can
reduce the electricity demand of storage space and retail shops. However, one thing
that should be mentioned here is additional electricity consumption will usually