

212
X. Zhang et al.
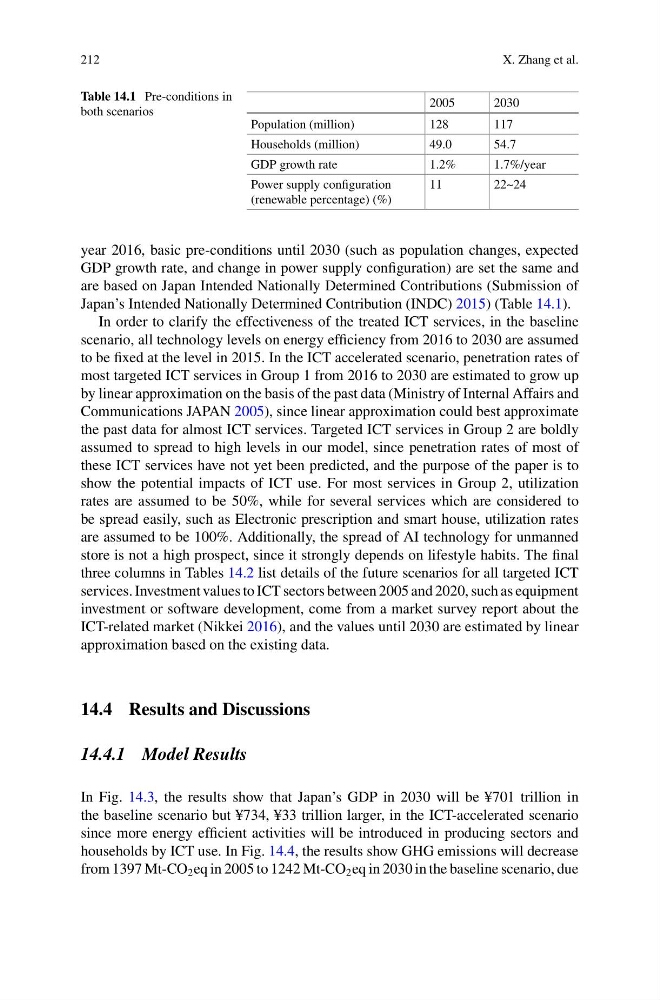
Table 14.1 Pre-conditions in
both scenarios
2005
2030
Population (million)
128
117
Households (million)
49.0
54.7
GDP growth rate
1.2%
1.7%/year
Power supply configuration
(renewable percentage) (%)
11
22~24
year 2016, basic pre-conditions until 2030 (such as population changes, expected
GDP growth rate, and change in power supply configuration) are set the same and
are based on Japan Intended Nationally Determined Contributions (Submission of
Japan’s Intended Nationally Determined Contribution (INDC) 2015) (Table 14.1).
In order to clarify the effectiveness of the treated ICT services, in the baseline
scenario, all technology levels on energy efficiency from 2016 to 2030 are assumed
to be fixed at the level in 2015. In the ICT accelerated scenario, penetration rates of
most targeted ICT services in Group 1 from 2016 to 2030 are estimated to grow up
by linear approximation on the basis of the past data (Ministry of Internal Affairs and
Communications JAPAN 2005), since linear approximation could best approximate
the past data for almost ICT services. Targeted ICT services in Group 2 are boldly
assumed to spread to high levels in our model, since penetration rates of most of
these ICT services have not yet been predicted, and the purpose of the paper is to
show the potential impacts of ICT use. For most services in Group 2, utilization
rates are assumed to be 50%, while for several services which are considered to
be spread easily, such as Electronic prescription and smart house, utilization rates
are assumed to be 100%. Additionally, the spread of AI technology for unmanned
store is not a high prospect, since it strongly depends on lifestyle habits. The final
three columns in Tables 14.2 list details of the future scenarios for all targeted ICT
services. Investment values to ICT sectors between 2005 and 2020, such as equipment
investment or software development, come from a market survey report about the
ICT-related market (Nikkei 2016), and the values until 2030 are estimated by linear
approximation based on the existing data.
14.4 Results and Discussions
14.4.1 Model Results
In Fig. 14.3, the results show that Japan’s GDP in 2030 will be ¥701 trillion in
the baseline scenario but ¥734, ¥33 trillion larger, in the ICT-accelerated scenario
since more energy efficient activities will be introduced in producing sectors and
households by ICT use. In Fig. 14.4, the results show GHG emissions will decrease
from 1397 Mt-CO 2 eq in 2005 to 1242 Mt-CO 2 eq in 2030 in the baseline scenario, due
X. Zhang et al.
Table 14.1 Pre-conditions in
both scenarios
2005
2030
Population (million)
128
117
Households (million)
49.0
54.7
GDP growth rate
1.2%
1.7%/year
Power supply configuration
(renewable percentage) (%)
11
22~24
year 2016, basic pre-conditions until 2030 (such as population changes, expected
GDP growth rate, and change in power supply configuration) are set the same and
are based on Japan Intended Nationally Determined Contributions (Submission of
Japan’s Intended Nationally Determined Contribution (INDC) 2015) (Table 14.1).
In order to clarify the effectiveness of the treated ICT services, in the baseline
scenario, all technology levels on energy efficiency from 2016 to 2030 are assumed
to be fixed at the level in 2015. In the ICT accelerated scenario, penetration rates of
most targeted ICT services in Group 1 from 2016 to 2030 are estimated to grow up
by linear approximation on the basis of the past data (Ministry of Internal Affairs and
Communications JAPAN 2005), since linear approximation could best approximate
the past data for almost ICT services. Targeted ICT services in Group 2 are boldly
assumed to spread to high levels in our model, since penetration rates of most of
these ICT services have not yet been predicted, and the purpose of the paper is to
show the potential impacts of ICT use. For most services in Group 2, utilization
rates are assumed to be 50%, while for several services which are considered to
be spread easily, such as Electronic prescription and smart house, utilization rates
are assumed to be 100%. Additionally, the spread of AI technology for unmanned
store is not a high prospect, since it strongly depends on lifestyle habits. The final
three columns in Tables 14.2 list details of the future scenarios for all targeted ICT
services. Investment values to ICT sectors between 2005 and 2020, such as equipment
investment or software development, come from a market survey report about the
ICT-related market (Nikkei 2016), and the values until 2030 are estimated by linear
approximation based on the existing data.
14.4 Results and Discussions
14.4.1 Model Results
In Fig. 14.3, the results show that Japan’s GDP in 2030 will be ¥701 trillion in
the baseline scenario but ¥734, ¥33 trillion larger, in the ICT-accelerated scenario
since more energy efficient activities will be introduced in producing sectors and
households by ICT use. In Fig. 14.4, the results show GHG emissions will decrease
from 1397 Mt-CO 2 eq in 2005 to 1242 Mt-CO 2 eq in 2030 in the baseline scenario, due