

11 Economy-Wide Material Flow Analysis and Its Projection …
167
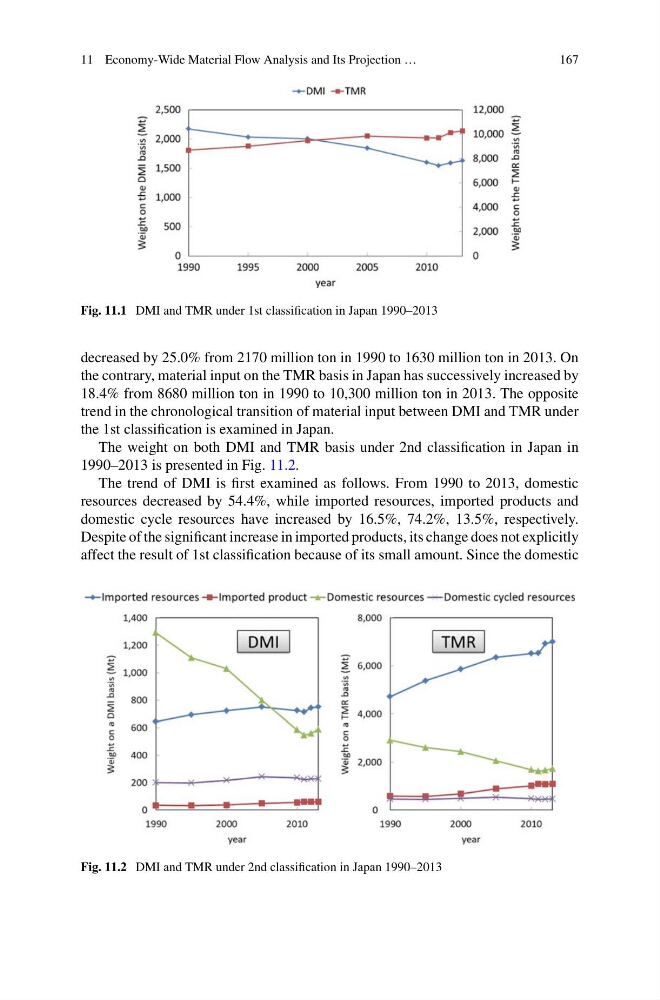
Fig. 11.1 DMI and TMR under 1st classification in Japan 1990–2013
decreased by 25.0% from 2170 million ton in 1990 to 1630 million ton in 2013. On
the contrary, material input on the TMR basis in Japan has successively increased by
18.4% from 8680 million ton in 1990 to 10,300 million ton in 2013. The opposite
trend in the chronological transition of material input between DMI and TMR under
the 1st classification is examined in Japan.
The weight on both DMI and TMR basis under 2nd classification in Japan in
1990–2013 is presented in Fig. 11.2.
The trend of DMI is first examined as follows. From 1990 to 2013, domestic
resources decreased by 54.4%, while imported resources, imported products and
domestic cycle resources have increased by 16.5%, 74.2%, 13.5%, respectively.
Despite of the significant increase in imported products, its change does not explicitly
affect the result of 1st classification because of its small amount. Since the domestic
Fig. 11.2 DMI and TMR under 2nd classification in Japan 1990–2013
167
Fig. 11.1 DMI and TMR under 1st classification in Japan 1990–2013
decreased by 25.0% from 2170 million ton in 1990 to 1630 million ton in 2013. On
the contrary, material input on the TMR basis in Japan has successively increased by
18.4% from 8680 million ton in 1990 to 10,300 million ton in 2013. The opposite
trend in the chronological transition of material input between DMI and TMR under
the 1st classification is examined in Japan.
The weight on both DMI and TMR basis under 2nd classification in Japan in
1990–2013 is presented in Fig. 11.2.
The trend of DMI is first examined as follows. From 1990 to 2013, domestic
resources decreased by 54.4%, while imported resources, imported products and
domestic cycle resources have increased by 16.5%, 74.2%, 13.5%, respectively.
Despite of the significant increase in imported products, its change does not explicitly
affect the result of 1st classification because of its small amount. Since the domestic
Fig. 11.2 DMI and TMR under 2nd classification in Japan 1990–2013