

120
M. Zolfaghari and S. J. Zafarmand
8.3.1.5 Users
Vehicles with low performance are less attractive for the users and make less satisfaction. All data about customer satisfaction was taken from ISQI official website
(2019).
In Table 8.2, the summary of dimensions, indicators definitions, resources and the
data for Toyota Yaris which is the highest sustainable car were presented.
8.3.1.6 Indicators Normalization, Calculate Composite Dimension
Transport indicators contain different types of information so there might be some
inconsistency in units among indicators. Therefore, before indicators aggregation, it
is necessary to transform them to numbers without any dimension. This process is
called normalization (Nardo et al. 2005). Indicators whose increasing values have
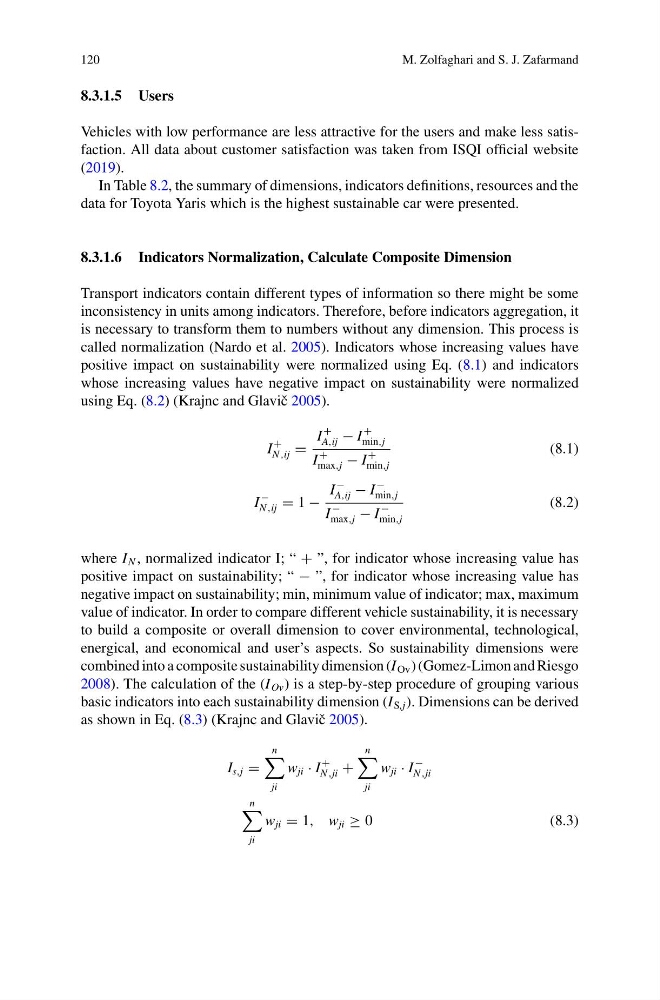
positive impact on sustainability were normalized using Eq. (8.1) and indicators
whose increasing values have negative impact on sustainability were normalized
using Eq. (8.2) (Krajnc and Glaviˇ c 2005).
I
+
N ,ij =
I
+
A,ij − I
+
min,j
I
+
max,j − I
+
min,j
(8.1)
I
−
N ,ij = 1 −
I
−
A,ij − I
−
min,j
I
−
max,j − I
−
min,j
(8.2)
where I N , normalized indicator I; “ + ”, for indicator whose increasing value has
positive impact on sustainability; “ − ”, for indicator whose increasing value has
negative impact on sustainability; min, minimum value of indicator; max, maximum
value of indicator. In order to compare different vehicle sustainability, it is necessary
to build a composite or overall dimension to cover environmental, technological,
energical, and economical and user’s aspects. So sustainability dimensions were
combined into a composite sustainability dimension (I Ov ) (Gomez-Limon and Riesgo
2008). The calculation of the (I Ov ) is a step-by-step procedure of grouping various
basic indicators into each sustainability dimension (I S,j ). Dimensions can be derived
as shown in Eq. (8.3) (Krajnc and Glaviˇ c 2005).
I s,j =
n
ji
w ji · I
+
N ,ji +
n
ji
w ji · I
−
N ,ji
n
ji
w ji = 1, w ji ≥ 0
(8.3)
M. Zolfaghari and S. J. Zafarmand
8.3.1.5 Users
Vehicles with low performance are less attractive for the users and make less satisfaction. All data about customer satisfaction was taken from ISQI official website
(2019).
In Table 8.2, the summary of dimensions, indicators definitions, resources and the
data for Toyota Yaris which is the highest sustainable car were presented.
8.3.1.6 Indicators Normalization, Calculate Composite Dimension
Transport indicators contain different types of information so there might be some
inconsistency in units among indicators. Therefore, before indicators aggregation, it
is necessary to transform them to numbers without any dimension. This process is
called normalization (Nardo et al. 2005). Indicators whose increasing values have
positive impact on sustainability were normalized using Eq. (8.1) and indicators
whose increasing values have negative impact on sustainability were normalized
using Eq. (8.2) (Krajnc and Glaviˇ c 2005).
I
+
N ,ij =
I
+
A,ij − I
+
min,j
I
+
max,j − I
+
min,j
(8.1)
I
−
N ,ij = 1 −
I
−
A,ij − I
−
min,j
I
−
max,j − I
−
min,j
(8.2)
where I N , normalized indicator I; “ + ”, for indicator whose increasing value has
positive impact on sustainability; “ − ”, for indicator whose increasing value has
negative impact on sustainability; min, minimum value of indicator; max, maximum
value of indicator. In order to compare different vehicle sustainability, it is necessary
to build a composite or overall dimension to cover environmental, technological,
energical, and economical and user’s aspects. So sustainability dimensions were
combined into a composite sustainability dimension (I Ov ) (Gomez-Limon and Riesgo
2008). The calculation of the (I Ov ) is a step-by-step procedure of grouping various
basic indicators into each sustainability dimension (I S,j ). Dimensions can be derived
as shown in Eq. (8.3) (Krajnc and Glaviˇ c 2005).
I s,j =
n
ji
w ji · I
+
N ,ji +
n
ji
w ji · I
−
N ,ji
n
ji
w ji = 1, w ji ≥ 0
(8.3)