

394
5 X-ray Pulsar-Based Navigation: Theories and Experiments
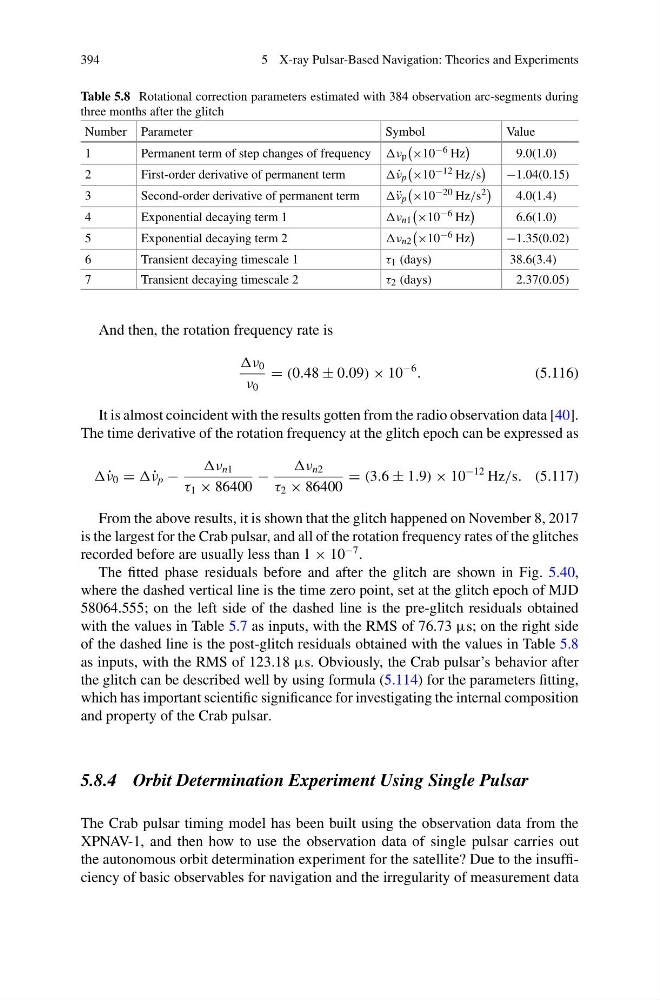
Table 5.8 Rotational correction parameters estimated with 384 observation arc-segments during
three months after the glitch
Number Parameter
Symbol
Value
1
Permanent term of step changes of frequency ν p
×10 −6 Hz
9.0(1.0)
2
First-order derivative of permanent term
˙ ν p
×10 −12 Hz/s
−1.04(0.15)
3
Second-order derivative of permanent term
¨ ν p
×10 −20 Hz/s 2
4.0(1.4)
4
Exponential decaying term 1
ν n1
×10 −6 Hz
6.6(1.0)
5
Exponential decaying term 2
ν n2
×10 −6 Hz
−1.35(0.02)
6
Transient decaying timescale 1
τ 1 (days)
38.6(3.4)
7
Transient decaying timescale 2
τ 2 (days)
2.37(0.05)
And then, the rotation frequency rate is
ν 0
ν 0
= (0.48 ± 0.09) × 10
−6
.
(5.116)
It is almost coincident with the results gotten from the radio observation data [40].
The time derivative of the rotation frequency at the glitch epoch can be expressed as
˙ ν 0 = ˙ ν p −
ν n1
τ 1 × 86400
−
ν n2
τ 2 × 86400
= (3.6 ± 1.9) × 10
−12 Hz/s. (5.117)
From the above results, it is shown that the glitch happened on November 8, 2017
is the largest for the Crab pulsar, and all of the rotation frequency rates of the glitches
recorded before are usually less than 1 × 10
−7 .
The fitted phase residuals before and after the glitch are shown in Fig. 5.40,
where the dashed vertical line is the time zero point, set at the glitch epoch of MJD
58064.555; on the left side of the dashed line is the pre-glitch residuals obtained
with the values in Table 5.7 as inputs, with the RMS of 76.73 μs; on the right side
of the dashed line is the post-glitch residuals obtained with the values in Table 5.8
as inputs, with the RMS of 123.18 μs. Obviously, the Crab pulsar’s behavior after
the glitch can be described well by using formula (5.114) for the parameters fitting,
which has important scientific significance for investigating the internal composition
and property of the Crab pulsar.
5.8.4 Orbit Determination Experiment Using Single Pulsar
The Crab pulsar timing model has been built using the observation data from the
XPNAV-1, and then how to use the observation data of single pulsar carries out
the autonomous orbit determination experiment for the satellite? Due to the insufficiency of basic observables for navigation and the irregularity of measurement data
5 X-ray Pulsar-Based Navigation: Theories and Experiments
Table 5.8 Rotational correction parameters estimated with 384 observation arc-segments during
three months after the glitch
Number Parameter
Symbol
Value
1
Permanent term of step changes of frequency ν p
×10 −6 Hz
9.0(1.0)
2
First-order derivative of permanent term
˙ ν p
×10 −12 Hz/s
−1.04(0.15)
3
Second-order derivative of permanent term
¨ ν p
×10 −20 Hz/s 2
4.0(1.4)
4
Exponential decaying term 1
ν n1
×10 −6 Hz
6.6(1.0)
5
Exponential decaying term 2
ν n2
×10 −6 Hz
−1.35(0.02)
6
Transient decaying timescale 1
τ 1 (days)
38.6(3.4)
7
Transient decaying timescale 2
τ 2 (days)
2.37(0.05)
And then, the rotation frequency rate is
ν 0
ν 0
= (0.48 ± 0.09) × 10
−6
.
(5.116)
It is almost coincident with the results gotten from the radio observation data [40].
The time derivative of the rotation frequency at the glitch epoch can be expressed as
˙ ν 0 = ˙ ν p −
ν n1
τ 1 × 86400
−
ν n2
τ 2 × 86400
= (3.6 ± 1.9) × 10
−12 Hz/s. (5.117)
From the above results, it is shown that the glitch happened on November 8, 2017
is the largest for the Crab pulsar, and all of the rotation frequency rates of the glitches
recorded before are usually less than 1 × 10
−7 .
The fitted phase residuals before and after the glitch are shown in Fig. 5.40,
where the dashed vertical line is the time zero point, set at the glitch epoch of MJD
58064.555; on the left side of the dashed line is the pre-glitch residuals obtained
with the values in Table 5.7 as inputs, with the RMS of 76.73 μs; on the right side
of the dashed line is the post-glitch residuals obtained with the values in Table 5.8
as inputs, with the RMS of 123.18 μs. Obviously, the Crab pulsar’s behavior after
the glitch can be described well by using formula (5.114) for the parameters fitting,
which has important scientific significance for investigating the internal composition
and property of the Crab pulsar.
5.8.4 Orbit Determination Experiment Using Single Pulsar
The Crab pulsar timing model has been built using the observation data from the
XPNAV-1, and then how to use the observation data of single pulsar carries out
the autonomous orbit determination experiment for the satellite? Due to the insufficiency of basic observables for navigation and the irregularity of measurement data