

6.7 Movement of Efimov States in 20 C Causing Resonance …
103
added that the choice on the values of the angle φ is not completely free. These
values are restricted by the requirement that the imaginary part of the scattering
amplitude calculated from the integral equation must be unitary; i.e., it must satisfy
the condition Im
f
−1
k
= −k.
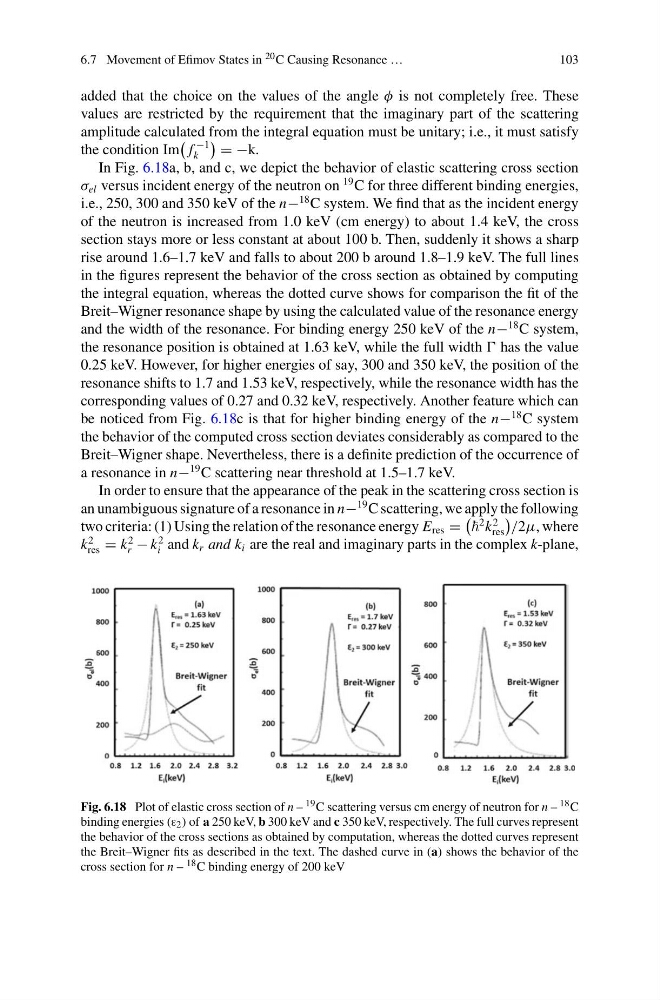
In Fig. 6.18a, b, and c, we depict the behavior of elastic scattering cross section
σ el versus incident energy of the neutron on
19 C for three different binding energies,
i.e., 250, 300 and 350 keV of the n−
18 C system. We find that as the incident energy
of the neutron is increased from 1.0 keV (cm energy) to about 1.4 keV, the cross
section stays more or less constant at about 100 b. Then, suddenly it shows a sharp
rise around 1.6–1.7 keV and falls to about 200 b around 1.8–1.9 keV. The full lines
in the figures represent the behavior of the cross section as obtained by computing
the integral equation, whereas the dotted curve shows for comparison the fit of the
Breit–Wigner resonance shape by using the calculated value of the resonance energy
and the width of the resonance. For binding energy 250 keV of the n−
18 C system,
the resonance position is obtained at 1.63 keV, while the full width has the value
0.25 keV. However, for higher energies of say, 300 and 350 keV, the position of the
resonance shifts to 1.7 and 1.53 keV, respectively, while the resonance width has the
corresponding values of 0.27 and 0.32 keV, respectively. Another feature which can
be noticed from Fig. 6.18c is that for higher binding energy of the n−
18 C system
the behavior of the computed cross section deviates considerably as compared to the
Breit–Wigner shape. Nevertheless, there is a definite prediction of the occurrence of
a resonance in n−
19 C scattering near threshold at 1.5–1.7 keV.
In order to ensure that the appearance of the peak in the scattering cross section is
an unambiguous signature of a resonance in n−
19 C scattering, we apply the following
two criteria: (1) Using the relation of the resonance energy E res =
2 k
2
res
/2μ, where
k
2
res = k
2
r − k
2
i and k r and k i are the real and imaginary parts in the complex k-plane,
Fig. 6.18 Plot of elastic cross section of n – 19 C scattering versus cm energy of neutron for n – 18 C
binding energies (ε 2 ) of a 250 keV, b 300 keV and c 350 keV, respectively. The full curves represent
the behavior of the cross sections as obtained by computation, whereas the dotted curves represent
the Breit–Wigner fits as described in the text. The dashed curve in (a) shows the behavior of the
cross section for n – 18 C binding energy of 200 keV
103
added that the choice on the values of the angle φ is not completely free. These
values are restricted by the requirement that the imaginary part of the scattering
amplitude calculated from the integral equation must be unitary; i.e., it must satisfy
the condition Im
f
−1
k
= −k.
In Fig. 6.18a, b, and c, we depict the behavior of elastic scattering cross section
σ el versus incident energy of the neutron on
19 C for three different binding energies,
i.e., 250, 300 and 350 keV of the n−
18 C system. We find that as the incident energy
of the neutron is increased from 1.0 keV (cm energy) to about 1.4 keV, the cross
section stays more or less constant at about 100 b. Then, suddenly it shows a sharp
rise around 1.6–1.7 keV and falls to about 200 b around 1.8–1.9 keV. The full lines
in the figures represent the behavior of the cross section as obtained by computing
the integral equation, whereas the dotted curve shows for comparison the fit of the
Breit–Wigner resonance shape by using the calculated value of the resonance energy
and the width of the resonance. For binding energy 250 keV of the n−
18 C system,
the resonance position is obtained at 1.63 keV, while the full width has the value
0.25 keV. However, for higher energies of say, 300 and 350 keV, the position of the
resonance shifts to 1.7 and 1.53 keV, respectively, while the resonance width has the
corresponding values of 0.27 and 0.32 keV, respectively. Another feature which can
be noticed from Fig. 6.18c is that for higher binding energy of the n−
18 C system
the behavior of the computed cross section deviates considerably as compared to the
Breit–Wigner shape. Nevertheless, there is a definite prediction of the occurrence of
a resonance in n−
19 C scattering near threshold at 1.5–1.7 keV.
In order to ensure that the appearance of the peak in the scattering cross section is
an unambiguous signature of a resonance in n−
19 C scattering, we apply the following
two criteria: (1) Using the relation of the resonance energy E res =
2 k
2
res
/2μ, where
k
2
res = k
2
r − k
2
i and k r and k i are the real and imaginary parts in the complex k-plane,
Fig. 6.18 Plot of elastic cross section of n – 19 C scattering versus cm energy of neutron for n – 18 C
binding energies (ε 2 ) of a 250 keV, b 300 keV and c 350 keV, respectively. The full curves represent
the behavior of the cross sections as obtained by computation, whereas the dotted curves represent
the Breit–Wigner fits as described in the text. The dashed curve in (a) shows the behavior of the
cross section for n – 18 C binding energy of 200 keV