

and tetrahedral symmetries. They allow to assign the crystal field of the spectra
from d
1 to d
9 configurations and to recognize both symmetry and electronic configuration of the ion.
Tanabe and Sugano alternatively described the cubic (octahedral and tetrahedral)
configurations by diagrams which report all the states for a single electronic configuration, independently of the similarity of their spin multiplicity. The diagrams
plot the electronic energies of the ions states against the Dq energy values. All the
energy values are measured in B (Racah) units in order to make the values independent of the different ions. On the left hand of the diagrams, we read the free ion
energies, on the right hand the energy for an infinitely strong field. When the strong
field configuration is not indicated, it is intended that it remains the same as the
lower energy state (Scheme 3.6).
From the d
4 to d
7 configuration, the diagrams contain a vertical line which
separates the high spin from the low spin region for the same ion. The two regions
are different in the ground and the other states.
The transitions in Tanabe–Sugano diagrams can be read by the same way as for
the Orgel diagrams and show the complete spectrum of the absorption bands.
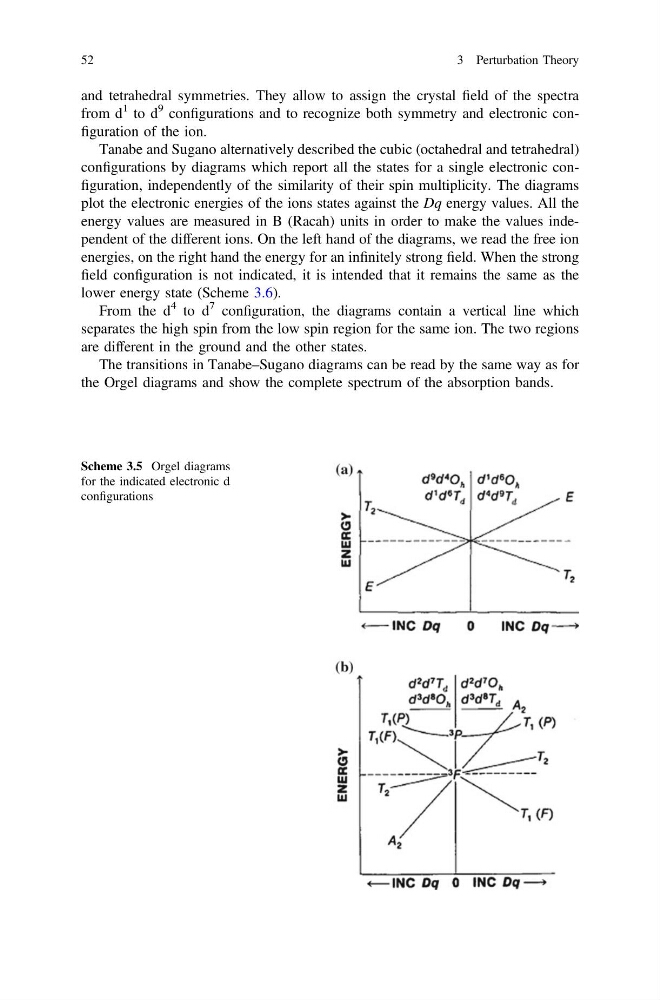
Scheme 3.5 Orgel diagrams
for the indicated electronic d
configurations
52
3 Perturbation Theory
from d
1 to d
9 configurations and to recognize both symmetry and electronic configuration of the ion.
Tanabe and Sugano alternatively described the cubic (octahedral and tetrahedral)
configurations by diagrams which report all the states for a single electronic configuration, independently of the similarity of their spin multiplicity. The diagrams
plot the electronic energies of the ions states against the Dq energy values. All the
energy values are measured in B (Racah) units in order to make the values independent of the different ions. On the left hand of the diagrams, we read the free ion
energies, on the right hand the energy for an infinitely strong field. When the strong
field configuration is not indicated, it is intended that it remains the same as the
lower energy state (Scheme 3.6).
From the d
4 to d
7 configuration, the diagrams contain a vertical line which
separates the high spin from the low spin region for the same ion. The two regions
are different in the ground and the other states.
The transitions in Tanabe–Sugano diagrams can be read by the same way as for
the Orgel diagrams and show the complete spectrum of the absorption bands.
Scheme 3.5 Orgel diagrams
for the indicated electronic d
configurations
52
3 Perturbation Theory