

5.63 Discussion of the Case
5.63.1 Electrochemistry
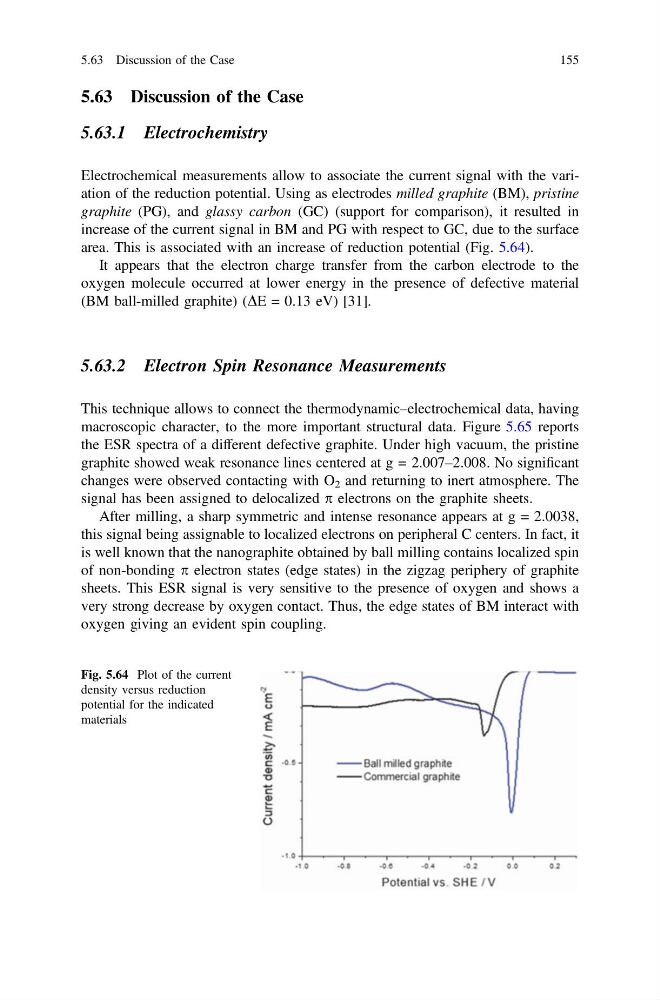
Electrochemical measurements allow to associate the current signal with the variation of the reduction potential. Using as electrodes milled graphite (BM), pristine
graphite (PG), and glassy carbon (GC) (support for comparison), it resulted in
increase of the current signal in BM and PG with respect to GC, due to the surface
area. This is associated with an increase of reduction potential (Fig. 5.64).
It appears that the electron charge transfer from the carbon electrode to the
oxygen molecule occurred at lower energy in the presence of defective material
(BM ball-milled graphite) (DE = 0.13 eV) [31].
5.63.2 Electron Spin Resonance Measurements
This technique allows to connect the thermodynamic–electrochemical data, having
macroscopic character, to the more important structural data. Figure 5.65 reports
the ESR spectra of a different defective graphite. Under high vacuum, the pristine
graphite showed weak resonance lines centered at g = 2.007–2.008. No significant
changes were observed contacting with O 2 and returning to inert atmosphere. The
signal has been assigned to delocalized p electrons on the graphite sheets.
After milling, a sharp symmetric and intense resonance appears at g = 2.0038,
this signal being assignable to localized electrons on peripheral C centers. In fact, it
is well known that the nanographite obtained by ball milling contains localized spin
of non-bonding p electron states (edge states) in the zigzag periphery of graphite
sheets. This ESR signal is very sensitive to the presence of oxygen and shows a
very strong decrease by oxygen contact. Thus, the edge states of BM interact with
oxygen giving an evident spin coupling.
Fig. 5.64 Plot of the current
density versus reduction
potential for the indicated
materials
5.63 Discussion of the Case
155
5.63.1 Electrochemistry
Electrochemical measurements allow to associate the current signal with the variation of the reduction potential. Using as electrodes milled graphite (BM), pristine
graphite (PG), and glassy carbon (GC) (support for comparison), it resulted in
increase of the current signal in BM and PG with respect to GC, due to the surface
area. This is associated with an increase of reduction potential (Fig. 5.64).
It appears that the electron charge transfer from the carbon electrode to the
oxygen molecule occurred at lower energy in the presence of defective material
(BM ball-milled graphite) (DE = 0.13 eV) [31].
5.63.2 Electron Spin Resonance Measurements
This technique allows to connect the thermodynamic–electrochemical data, having
macroscopic character, to the more important structural data. Figure 5.65 reports
the ESR spectra of a different defective graphite. Under high vacuum, the pristine
graphite showed weak resonance lines centered at g = 2.007–2.008. No significant
changes were observed contacting with O 2 and returning to inert atmosphere. The
signal has been assigned to delocalized p electrons on the graphite sheets.
After milling, a sharp symmetric and intense resonance appears at g = 2.0038,
this signal being assignable to localized electrons on peripheral C centers. In fact, it
is well known that the nanographite obtained by ball milling contains localized spin
of non-bonding p electron states (edge states) in the zigzag periphery of graphite
sheets. This ESR signal is very sensitive to the presence of oxygen and shows a
very strong decrease by oxygen contact. Thus, the edge states of BM interact with
oxygen giving an evident spin coupling.
Fig. 5.64 Plot of the current
density versus reduction
potential for the indicated
materials
5.63 Discussion of the Case
155