

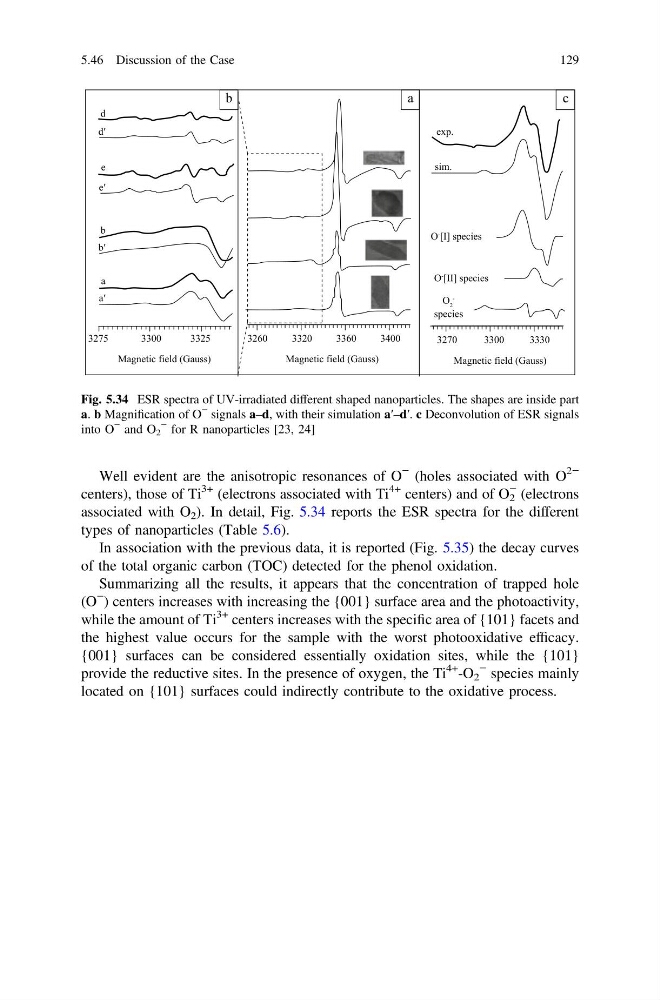
Well evident are the anisotropic resonances of O
− (holes associated with O
2−
centers), those of Ti
3+ (electrons associated with Ti
4+ centers) and of O 2
− (electrons
associated with O 2 ). In detail, Fig. 5.34 reports the ESR spectra for the different
types of nanoparticles (Table 5.6).
In association with the previous data, it is reported (Fig. 5.35) the decay curves
of the total organic carbon (TOC) detected for the phenol oxidation.
Summarizing all the results, it appears that the concentration of trapped hole
(O
− ) centers increases with increasing the {001} surface area and the photoactivity,
while the amount of Ti
3+ centers increases with the specific area of {101} facets and
the highest value occurs for the sample with the worst photooxidative efficacy.
{001} surfaces can be considered essentially oxidation sites, while the {101}
provide the reductive sites. In the presence of oxygen, the Ti
4+ -O 2
− species mainly
located on {101} surfaces could indirectly contribute to the oxidative process.
d
b
a
c
d′
e
e′
b
b′
a
3275
3300
Magnetic field (Gauss)
Magnetic field (Gauss)
Magnetic field (Gauss)
3325
3260
exp.
sim.
O
- [I] species
O
- [II] species
species
O 2
-
3320
3360
3400
3270
3300
3330
a′
Fig. 5.34 ESR spectra of UV-irradiated different shaped nanoparticles. The shapes are inside part
a. b Magnification of O
− signals a–d, with their simulation a′–d′. c Deconvolution of ESR signals
into O
− and O 2
− for R nanoparticles [23, 24]
5.46 Discussion of the Case
129
− (holes associated with O
2−
centers), those of Ti
3+ (electrons associated with Ti
4+ centers) and of O 2
− (electrons
associated with O 2 ). In detail, Fig. 5.34 reports the ESR spectra for the different
types of nanoparticles (Table 5.6).
In association with the previous data, it is reported (Fig. 5.35) the decay curves
of the total organic carbon (TOC) detected for the phenol oxidation.
Summarizing all the results, it appears that the concentration of trapped hole
(O
− ) centers increases with increasing the {001} surface area and the photoactivity,
while the amount of Ti
3+ centers increases with the specific area of {101} facets and
the highest value occurs for the sample with the worst photooxidative efficacy.
{001} surfaces can be considered essentially oxidation sites, while the {101}
provide the reductive sites. In the presence of oxygen, the Ti
4+ -O 2
− species mainly
located on {101} surfaces could indirectly contribute to the oxidative process.
d
b
a
c
d′
e
e′
b
b′
a
3275
3300
Magnetic field (Gauss)
Magnetic field (Gauss)
Magnetic field (Gauss)
3325
3260
exp.
sim.
O
- [I] species
O
- [II] species
species
O 2
-
3320
3360
3400
3270
3300
3330
a′
Fig. 5.34 ESR spectra of UV-irradiated different shaped nanoparticles. The shapes are inside part
a. b Magnification of O
− signals a–d, with their simulation a′–d′. c Deconvolution of ESR signals
into O
− and O 2
− for R nanoparticles [23, 24]
5.46 Discussion of the Case
129