

64
METHODS OF MEASURING PROPERTIES
1.6 1
1
~~
~~
2
3
4
5
6
7
8
Radius (nm)
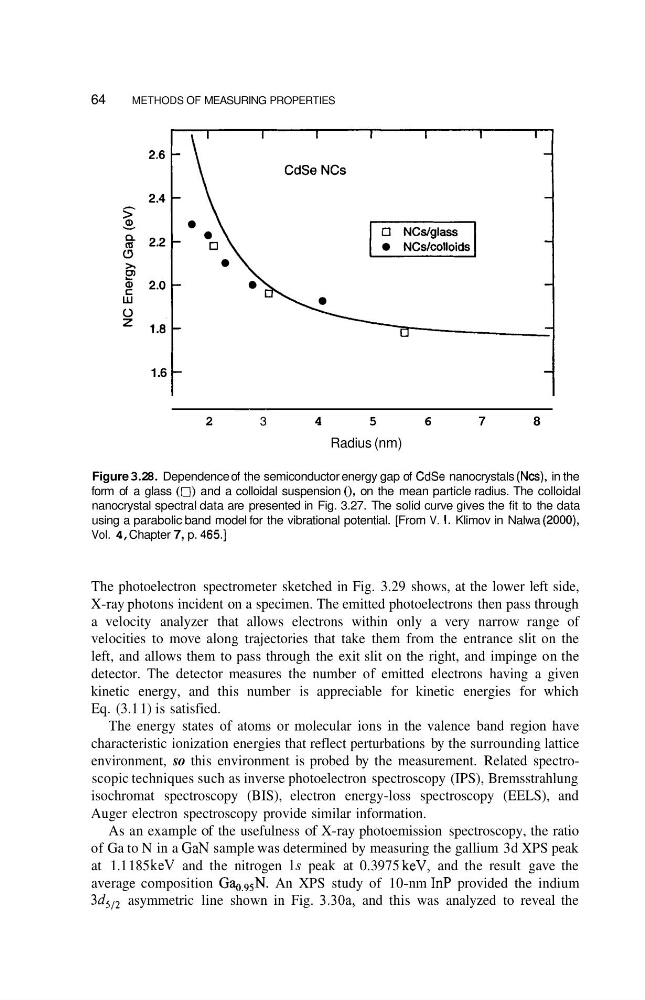
Figure 3.28. Dependence of the semiconductor energy gap of CdSe nanocrystals (Ncs), in the
form of a glass (0) and a colloidal suspension (), on the mean particle radius. The colloidal
nanocrystal spectral data are presented in Fig. 3.27. The solid curve gives the fit to the data
using a parabolic band model for the vibrational potential. [From V. I. Klimov in Nalwa (2000),
Vol. 4, Chapter 7, p. 465.1
The photoelectron spectrometer sketched in Fig. 3.29 shows, at the lower left side,
X-ray photons incident on a specimen. The emitted photoelectrons then pass through
a velocity analyzer that allows electrons within only a very narrow range of
velocities to move along trajectories that take them from the entrance slit on the
left, and allows them to pass through the exit slit on the right, and impinge on the
detector. The detector measures the number of emitted electrons having a given
kinetic energy, and this number is appreciable for kinetic energies for which
Eq. (3.1 1) is satisfied.
The energy states of atoms or molecular ions in the valence band region have
characteristic ionization energies that reflect perturbations by the surrounding lattice
environment, so this environment is probed by the measurement. Related spectroscopic techniques such as inverse photoelectron spectroscopy (IPS), Bremsstrahlung
isochromat spectroscopy (BIS), electron energy-loss spectroscopy (EELS), and
Auger electron spectroscopy provide similar information.
As an example of the usefulness of X-ray photoemission spectroscopy, the ratio
of Ga to N in a GaN sample was determined by measuring the gallium 3d XPS peak
at 1.1 185 keV and the nitrogen 1s peak at 0.3975 keV, and the result gave the
average composition Ga,,95N. An XPS study of 10-nm InP provided the indium
3d5,, asymmetric line shown in Fig. 3.30a, and this was analyzed to reveal the
METHODS OF MEASURING PROPERTIES
1.6 1
1
~~
~~
2
3
4
5
6
7
8
Radius (nm)
Figure 3.28. Dependence of the semiconductor energy gap of CdSe nanocrystals (Ncs), in the
form of a glass (0) and a colloidal suspension (), on the mean particle radius. The colloidal
nanocrystal spectral data are presented in Fig. 3.27. The solid curve gives the fit to the data
using a parabolic band model for the vibrational potential. [From V. I. Klimov in Nalwa (2000),
Vol. 4, Chapter 7, p. 465.1
The photoelectron spectrometer sketched in Fig. 3.29 shows, at the lower left side,
X-ray photons incident on a specimen. The emitted photoelectrons then pass through
a velocity analyzer that allows electrons within only a very narrow range of
velocities to move along trajectories that take them from the entrance slit on the
left, and allows them to pass through the exit slit on the right, and impinge on the
detector. The detector measures the number of emitted electrons having a given
kinetic energy, and this number is appreciable for kinetic energies for which
Eq. (3.1 1) is satisfied.
The energy states of atoms or molecular ions in the valence band region have
characteristic ionization energies that reflect perturbations by the surrounding lattice
environment, so this environment is probed by the measurement. Related spectroscopic techniques such as inverse photoelectron spectroscopy (IPS), Bremsstrahlung
isochromat spectroscopy (BIS), electron energy-loss spectroscopy (EELS), and
Auger electron spectroscopy provide similar information.
As an example of the usefulness of X-ray photoemission spectroscopy, the ratio
of Ga to N in a GaN sample was determined by measuring the gallium 3d XPS peak
at 1.1 185 keV and the nitrogen 1s peak at 0.3975 keV, and the result gave the
average composition Ga,,95N. An XPS study of 10-nm InP provided the indium
3d5,, asymmetric line shown in Fig. 3.30a, and this was analyzed to reveal the