

3.4. SPECTROSCOPY
61
Average
Panicle
FWHM
Size (nm)
inSio2 Icm-') 1
260 280 300 320 340
RAMAN SHIFT (cm-'1
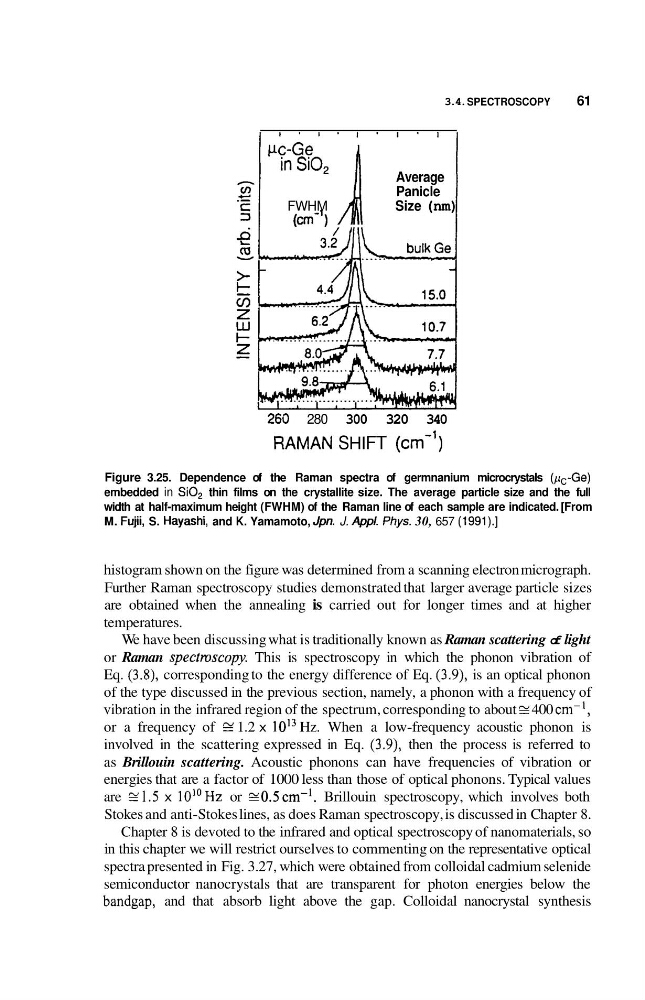
Figure 3.25. Dependence of the Raman spectra of germnanium microcrystals (pc-Ge)
embedded in 30, thin films on the crystallite size. The average particle size and the full
width at half-maximum height (FWHM) of the Raman line of each sample are indicated. [From
M. Fuji, S. Hayashi, and K. Yamamoto, Jpn. J. Appl. Phys. 30, 657 (1991).]
histogram shown on the figure was determined from a scanning electron micrograph.
Further Raman spectroscopy studies demonstrated that larger average particle sizes
are obtained when the annealing is carried out for longer times and at higher
temperatures.
We have been discussing what is traditionally known as Raman scattering of light
or Raman spectmscopy. This is spectroscopy in which the phonon vibration of
Eq. (3.8), corresponding to the energy difference of Eq. (3.9), is an optical phonon
of the type discussed in the previous section, namely, a phonon with a frequency of
vibration in the infrared region of the spectrum, corresponding to about E 400 cm-',
or a frequency of E' 1.2 x 10¹³ Hz. When a low-frequency acoustic phonon is
involved in the scattering expressed in Eq. (3.9), then the process is referred to
as Brillouin scattering. Acoustic phonons can have frequencies of vibration or
energies that are a factor of 1000 less than those of optical phonons. Typical values
are s l . 5 x 10"Hz or E0.5cm-'. Brillouin spectroscopy, which involves both
Stokes and anti-Stokes lines, as does Raman spectroscopy, is discussed in Chapter 8.
Chapter 8 is devoted to the infrared and optical spectroscopy of nanomaterials, so
in this chapter we will restrict ourselves to commenting on the representative optical
spectra presented in Fig. 3.27, which were obtained from colloidal cadmium selenide
semiconductor nanocrystals that are transparent for photon energies below the
bandgap, and that absorb light above the gap. Colloidal nanocrystal synthesis
61
Average
Panicle
FWHM
Size (nm)
inSio2 Icm-') 1
260 280 300 320 340
RAMAN SHIFT (cm-'1
Figure 3.25. Dependence of the Raman spectra of germnanium microcrystals (pc-Ge)
embedded in 30, thin films on the crystallite size. The average particle size and the full
width at half-maximum height (FWHM) of the Raman line of each sample are indicated. [From
M. Fuji, S. Hayashi, and K. Yamamoto, Jpn. J. Appl. Phys. 30, 657 (1991).]
histogram shown on the figure was determined from a scanning electron micrograph.
Further Raman spectroscopy studies demonstrated that larger average particle sizes
are obtained when the annealing is carried out for longer times and at higher
temperatures.
We have been discussing what is traditionally known as Raman scattering of light
or Raman spectmscopy. This is spectroscopy in which the phonon vibration of
Eq. (3.8), corresponding to the energy difference of Eq. (3.9), is an optical phonon
of the type discussed in the previous section, namely, a phonon with a frequency of
vibration in the infrared region of the spectrum, corresponding to about E 400 cm-',
or a frequency of E' 1.2 x 10¹³ Hz. When a low-frequency acoustic phonon is
involved in the scattering expressed in Eq. (3.9), then the process is referred to
as Brillouin scattering. Acoustic phonons can have frequencies of vibration or
energies that are a factor of 1000 less than those of optical phonons. Typical values
are s l . 5 x 10"Hz or E0.5cm-'. Brillouin spectroscopy, which involves both
Stokes and anti-Stokes lines, as does Raman spectroscopy, is discussed in Chapter 8.
Chapter 8 is devoted to the infrared and optical spectroscopy of nanomaterials, so
in this chapter we will restrict ourselves to commenting on the representative optical
spectra presented in Fig. 3.27, which were obtained from colloidal cadmium selenide
semiconductor nanocrystals that are transparent for photon energies below the
bandgap, and that absorb light above the gap. Colloidal nanocrystal synthesis