

272
SELF-ASSEMBLY AND CATALYSIS
20
220
420
620
Temperature (“C)
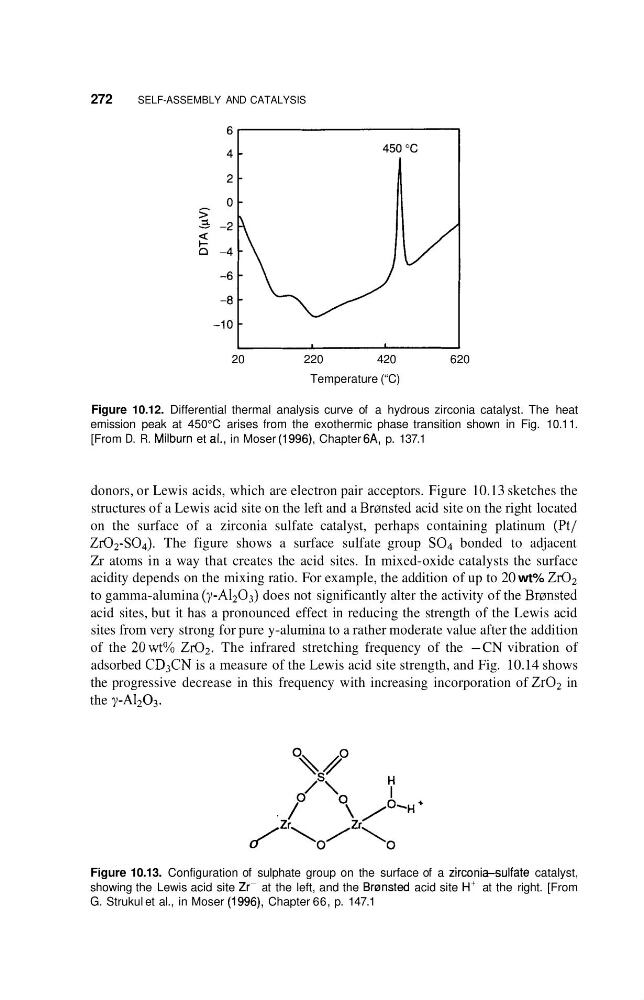
Figure 10.12. Differential thermal analysis curve of a hydrous zirconia catalyst. The heat
emission peak at 450°C arises from the exothermic phase transition shown in Fig. 10.1 1.
[From D. R. Milburn et ai., in Moser (1996), Chapter 6A, p. 137.1
donors, or Lewis acids, which are electron pair acceptors. Figure 10.13 sketches the
structures of a Lewis acid site on the left and a Brransted acid site on the right located
on the surface of a zirconia sulfate catalyst, perhaps containing platinum (Pt/
Zr02-S04). The figure shows a surface sulfate group SO4 bonded to adjacent
Zr atoms in a way that creates the acid sites. In mixed-oxide catalysts the surface
acidity depends on the mixing ratio. For example, the addition of up to 20 wt% Zr02
to gamma-alumina (y-A1203) does not significantly alter the activity of the Brransted
acid sites, but it has a pronounced effect in reducing the strength of the Lewis acid
sites from very strong for pure y-alumina to a rather moderate value after the addition
of the 20wt% Zr02. The infrared stretching frequency of the -CN vibration of
adsorbed CD3CN is a measure of the Lewis acid site strength, and Fig. 10.14 shows
the progressive decrease in this frequency with increasing incorporation of Zr02 in
the y-AI2O3.
/
0
Figure 10.13. Configuration of sulphate group on the surface of a zirconi+sulfate catalyst,
showing the Lewis acid site Zrr at the left, and the Brmsted acid site Hi at the right. [From
G. Strukul et al., in Moser (1996), Chapter 66, p. 147.1
SELF-ASSEMBLY AND CATALYSIS
20
220
420
620
Temperature (“C)
Figure 10.12. Differential thermal analysis curve of a hydrous zirconia catalyst. The heat
emission peak at 450°C arises from the exothermic phase transition shown in Fig. 10.1 1.
[From D. R. Milburn et ai., in Moser (1996), Chapter 6A, p. 137.1
donors, or Lewis acids, which are electron pair acceptors. Figure 10.13 sketches the
structures of a Lewis acid site on the left and a Brransted acid site on the right located
on the surface of a zirconia sulfate catalyst, perhaps containing platinum (Pt/
Zr02-S04). The figure shows a surface sulfate group SO4 bonded to adjacent
Zr atoms in a way that creates the acid sites. In mixed-oxide catalysts the surface
acidity depends on the mixing ratio. For example, the addition of up to 20 wt% Zr02
to gamma-alumina (y-A1203) does not significantly alter the activity of the Brransted
acid sites, but it has a pronounced effect in reducing the strength of the Lewis acid
sites from very strong for pure y-alumina to a rather moderate value after the addition
of the 20wt% Zr02. The infrared stretching frequency of the -CN vibration of
adsorbed CD3CN is a measure of the Lewis acid site strength, and Fig. 10.14 shows
the progressive decrease in this frequency with increasing incorporation of Zr02 in
the y-AI2O3.
/
0
Figure 10.13. Configuration of sulphate group on the surface of a zirconi+sulfate catalyst,
showing the Lewis acid site Zrr at the left, and the Brmsted acid site Hi at the right. [From
G. Strukul et al., in Moser (1996), Chapter 66, p. 147.1