

222
OPTICAL AND VIBRATIONAL SPECTROSCOPY
20
15
-
m
?
-
.- a 10
v)
c
(I)
c
-
-
5
I
I
I
0
250
300
350
400
450
Temperature (K)
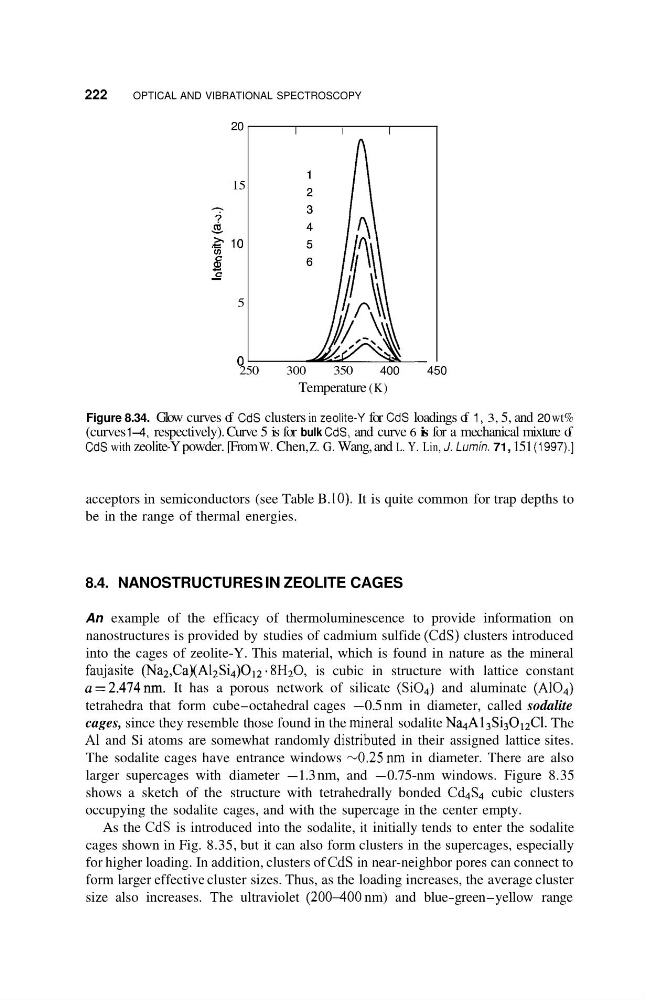
Figure 8.34. Glow curves of CdS clusters in zeolite-\/ for CdS loadings of 1, 3, 5, and 20 wt%
(curves 1-4, respectively). Curve 5 is for bulk CdS, and curve 6 is for a mechanical mixture of
CdS with zeolite-Y powder. [From W. Chen, Z. G. Wang, and L. Y. Lin, J. Lurnin. 71, 151 (1997).]
acceptors in semiconductors (see Table B. IO). It is quite common for trap depths to
be in the range of thermal energies.
8.4. NANOSTRUCTURES IN ZEOLITE CAGES
An example of the efficacy of thermoluminescence to provide information on
nanostructures is provided by studies of cadmium sulfide (CdS) clusters introduced
into the cages of zeolite-Y. This material, which is found in nature as the mineral
faujasite (Na2,Ca)(AlzSi4)Ol2. 8H20, is cubic in structure with lattice constant
a=2.474nm. It has a porous network of silicate (SO4) and aluminate (A104)
tetrahedra that form cube-octahedral cages -0.5 nm in diameter, called sodalite
cages, since they resemble those found in the mineral sodalite Na4Al3Si3OI2C1. The
A1 and Si atoms are somewhat randomly distributed in their assigned lattice sites.
The sodalite cages have entrance windows -0.25nm in diameter. There are also
larger supercages with diameter -1.3 nm, and -0.75-nm windows. Figure 8.35
shows a sketch of the structure with tetrahedrally bonded Cd4S4 cubic clusters
occupying the sodalite cages, and with the supercage in the center empty.
As the CdS is introduced into the sodalite, it initially tends to enter the sodalite
cages shown in Fig. 8.35, but it can also form clusters in the supercages, especially
for higher loading. In addition, clusters of CdS in near-neighbor pores can connect to
form larger effective cluster sizes. Thus, as the loading increases, the average cluster
size also increases. The ultraviolet (200400 nm) and blue-green-yellow range
OPTICAL AND VIBRATIONAL SPECTROSCOPY
20
15
-
m
?
-
.- a 10
v)
c
(I)
c
-
-
5
I
I
I
0
250
300
350
400
450
Temperature (K)
Figure 8.34. Glow curves of CdS clusters in zeolite-\/ for CdS loadings of 1, 3, 5, and 20 wt%
(curves 1-4, respectively). Curve 5 is for bulk CdS, and curve 6 is for a mechanical mixture of
CdS with zeolite-Y powder. [From W. Chen, Z. G. Wang, and L. Y. Lin, J. Lurnin. 71, 151 (1997).]
acceptors in semiconductors (see Table B. IO). It is quite common for trap depths to
be in the range of thermal energies.
8.4. NANOSTRUCTURES IN ZEOLITE CAGES
An example of the efficacy of thermoluminescence to provide information on
nanostructures is provided by studies of cadmium sulfide (CdS) clusters introduced
into the cages of zeolite-Y. This material, which is found in nature as the mineral
faujasite (Na2,Ca)(AlzSi4)Ol2. 8H20, is cubic in structure with lattice constant
a=2.474nm. It has a porous network of silicate (SO4) and aluminate (A104)
tetrahedra that form cube-octahedral cages -0.5 nm in diameter, called sodalite
cages, since they resemble those found in the mineral sodalite Na4Al3Si3OI2C1. The
A1 and Si atoms are somewhat randomly distributed in their assigned lattice sites.
The sodalite cages have entrance windows -0.25nm in diameter. There are also
larger supercages with diameter -1.3 nm, and -0.75-nm windows. Figure 8.35
shows a sketch of the structure with tetrahedrally bonded Cd4S4 cubic clusters
occupying the sodalite cages, and with the supercage in the center empty.
As the CdS is introduced into the sodalite, it initially tends to enter the sodalite
cages shown in Fig. 8.35, but it can also form clusters in the supercages, especially
for higher loading. In addition, clusters of CdS in near-neighbor pores can connect to
form larger effective cluster sizes. Thus, as the loading increases, the average cluster
size also increases. The ultraviolet (200400 nm) and blue-green-yellow range