

220
OPTICAL AND VIBRATIONAL SPECTROSCOPY
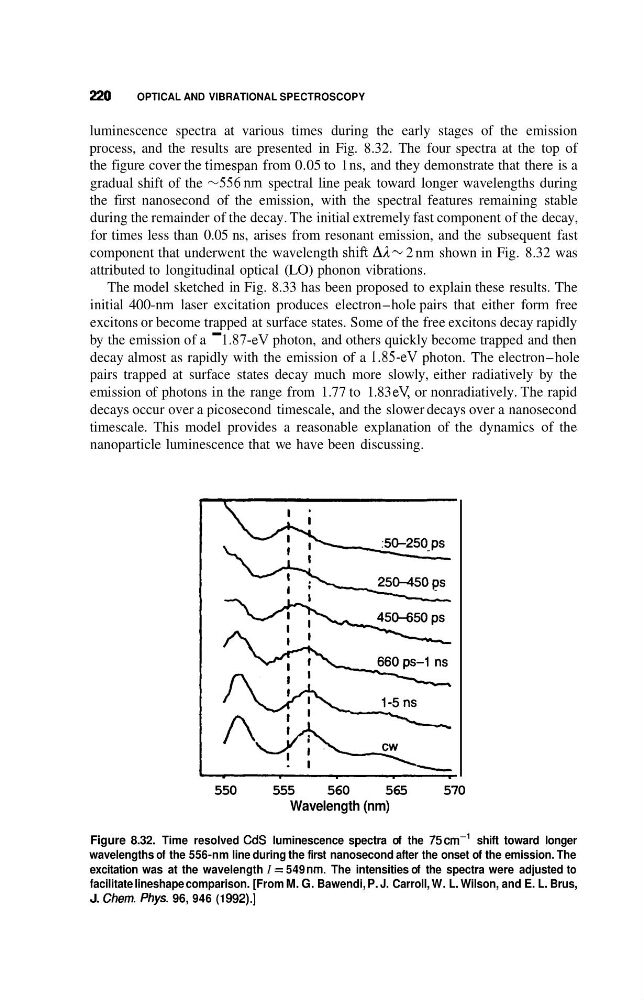
luminescence spectra at various times during the early stages of the emission
process, and the results are presented in Fig. 8.32. The four spectra at the top of
the figure cover the timespan from 0.05 to 1 ns, and they demonstrate that there is a
gradual shift of the -556nm spectral line peak toward longer wavelengths during
the first nanosecond of the emission, with the spectral features remaining stable
during the remainder of the decay. The initial extremely fast component of the decay,
for times less than 0.05 ns, arises from resonant emission, and the subsequent fast
component that underwent the wavelength shift A1 - 2 nm shown in Fig. 8.32 was
attributed to longitudinal optical (LO) phonon vibrations.
The model sketched in Fig. 8.33 has been proposed to explain these results. The
initial 400-nm laser excitation produces electron-hole pairs that either form free
excitons or become trapped at surface states. Some of the free excitons decay rapidly
by the emission of a - 1.87-eV photon, and others quickly become trapped and then
decay almost as rapidly with the emission of a 1.85-eV photon. The electron-hole
pairs trapped at surface states decay much more slowly, either radiatively by the
emission of photons in the range from 1.77 to 1.83 eV, or nonradiatively. The rapid
decays occur over a picosecond timescale, and the slower decays over a nanosecond
timescale. This model provides a reasonable explanation of the dynamics of the
nanoparticle luminescence that we have been discussing.
550
555
560
565
570
Wavelength (nm)
Figure 8.32. Time resolved CdS luminescence spectra of the 75cm-’ shift toward longer
wavelengths of the 556-nm line during the first nanosecond after the onset of the emission. The
excitation was at the wavelength I = 549 nm. The intensities of the spectra were adjusted to
facilitate lineshape comparison. [From M. G. Bawendi, P. J. Carroll, W. L. Wilson, and E. L. Brus,
J. Chern. Phys. 96, 946 (1 992).]
OPTICAL AND VIBRATIONAL SPECTROSCOPY
luminescence spectra at various times during the early stages of the emission
process, and the results are presented in Fig. 8.32. The four spectra at the top of
the figure cover the timespan from 0.05 to 1 ns, and they demonstrate that there is a
gradual shift of the -556nm spectral line peak toward longer wavelengths during
the first nanosecond of the emission, with the spectral features remaining stable
during the remainder of the decay. The initial extremely fast component of the decay,
for times less than 0.05 ns, arises from resonant emission, and the subsequent fast
component that underwent the wavelength shift A1 - 2 nm shown in Fig. 8.32 was
attributed to longitudinal optical (LO) phonon vibrations.
The model sketched in Fig. 8.33 has been proposed to explain these results. The
initial 400-nm laser excitation produces electron-hole pairs that either form free
excitons or become trapped at surface states. Some of the free excitons decay rapidly
by the emission of a - 1.87-eV photon, and others quickly become trapped and then
decay almost as rapidly with the emission of a 1.85-eV photon. The electron-hole
pairs trapped at surface states decay much more slowly, either radiatively by the
emission of photons in the range from 1.77 to 1.83 eV, or nonradiatively. The rapid
decays occur over a picosecond timescale, and the slower decays over a nanosecond
timescale. This model provides a reasonable explanation of the dynamics of the
nanoparticle luminescence that we have been discussing.
550
555
560
565
570
Wavelength (nm)
Figure 8.32. Time resolved CdS luminescence spectra of the 75cm-’ shift toward longer
wavelengths of the 556-nm line during the first nanosecond after the onset of the emission. The
excitation was at the wavelength I = 549 nm. The intensities of the spectra were adjusted to
facilitate lineshape comparison. [From M. G. Bawendi, P. J. Carroll, W. L. Wilson, and E. L. Brus,
J. Chern. Phys. 96, 946 (1 992).]