

218
OPTICAL AND VIBRATIONAL SPECTROSCOPY
emission at longer wavelengths. We also see from this figure that the addition of
nitromethane (CH3N02) quenches the fluorescence by bringing about a shift toward
longer wavelengths, plus an appreciable decrease in the magnitude of the broad
band, and in addition it practically eliminates the sharp exciton emission. The
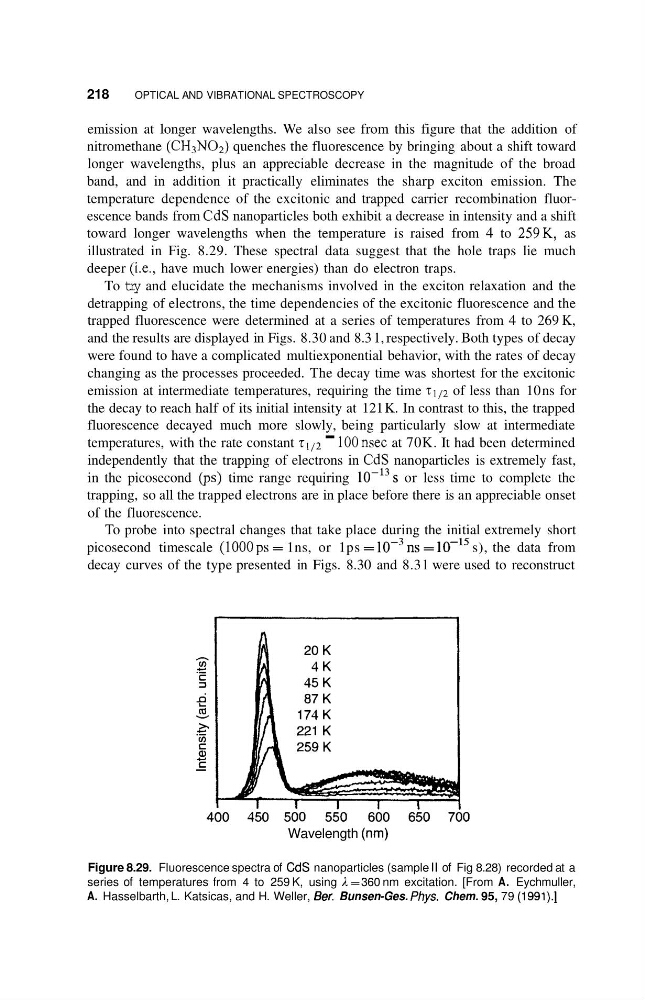
temperature dependence of the excitonic and trapped carrier recombination fluorescence bands from CdS nanoparticles both exhibit a decrease in intensity and a shift
toward longer wavelengths when the temperature is raised from 4 to 259K, as
illustrated in Fig. 8.29. These spectral data suggest that the hole traps lie much
deeper (i.e., have much lower energies) than do electron traps.
To try and elucidate the mechanisms involved in the exciton relaxation and the
detrapping of electrons, the time dependencies of the excitonic fluorescence and the
trapped fluorescence were determined at a series of temperatures from 4 to 269 K,
and the results are displayed in Figs. 8.30 and 8.3 1, respectively. Both types of decay
were found to have a complicated multiexponential behavior, with the rates of decay
changing as the processes proceeded. The decay time was shortest for the excitonic
emission at intermediate temperatures, requiring the time z1/2 of less than 10 ns for
the decay to reach half of its initial intensity at 121 K. In contrast to this, the trapped
fluorescence decayed much more slowly, being particularly slow at intermediate
temperatures, with the rate constant rl,2 - l00nsec at 70K. It had been determined
independently that the trapping of electrons in CdS nanoparticles is extremely fast,
in the picosecond (ps) time range requiring 10-13s or less time to complete the
trapping, so all the trapped electrons are in place before there is an appreciable onset
of the fluorescence.
To probe into spectral changes that take place during the initial extremely short
picosecond timescale (1OOOps = 1 ns, or 1 ps = lO-'ns =
s), the data from
decay curves of the type presented in Figs. 8.30 and 8.3 1 were used to reconstruct
Wavelength (nrn)
Figure 8.29. Fluorescence spectra of CdS nanoparticles (sample II of Fig 8.28) recorded at a
series of temperatures from 4 to 259 K, using A = 360 nm excitation. [From A. Eychmuller,
A. Hasselbarth, L. Katsicas, and H. Weller, Ber. Bunsen-Ges. Phys. Chem. 95, 79 (1991).]
OPTICAL AND VIBRATIONAL SPECTROSCOPY
emission at longer wavelengths. We also see from this figure that the addition of
nitromethane (CH3N02) quenches the fluorescence by bringing about a shift toward
longer wavelengths, plus an appreciable decrease in the magnitude of the broad
band, and in addition it practically eliminates the sharp exciton emission. The
temperature dependence of the excitonic and trapped carrier recombination fluorescence bands from CdS nanoparticles both exhibit a decrease in intensity and a shift
toward longer wavelengths when the temperature is raised from 4 to 259K, as
illustrated in Fig. 8.29. These spectral data suggest that the hole traps lie much
deeper (i.e., have much lower energies) than do electron traps.
To try and elucidate the mechanisms involved in the exciton relaxation and the
detrapping of electrons, the time dependencies of the excitonic fluorescence and the
trapped fluorescence were determined at a series of temperatures from 4 to 269 K,
and the results are displayed in Figs. 8.30 and 8.3 1, respectively. Both types of decay
were found to have a complicated multiexponential behavior, with the rates of decay
changing as the processes proceeded. The decay time was shortest for the excitonic
emission at intermediate temperatures, requiring the time z1/2 of less than 10 ns for
the decay to reach half of its initial intensity at 121 K. In contrast to this, the trapped
fluorescence decayed much more slowly, being particularly slow at intermediate
temperatures, with the rate constant rl,2 - l00nsec at 70K. It had been determined
independently that the trapping of electrons in CdS nanoparticles is extremely fast,
in the picosecond (ps) time range requiring 10-13s or less time to complete the
trapping, so all the trapped electrons are in place before there is an appreciable onset
of the fluorescence.
To probe into spectral changes that take place during the initial extremely short
picosecond timescale (1OOOps = 1 ns, or 1 ps = lO-'ns =
s), the data from
decay curves of the type presented in Figs. 8.30 and 8.3 1 were used to reconstruct
Wavelength (nrn)
Figure 8.29. Fluorescence spectra of CdS nanoparticles (sample II of Fig 8.28) recorded at a
series of temperatures from 4 to 259 K, using A = 360 nm excitation. [From A. Eychmuller,
A. Hasselbarth, L. Katsicas, and H. Weller, Ber. Bunsen-Ges. Phys. Chem. 95, 79 (1991).]