

E1C02 09/14/2010
13:35:23 Page 75
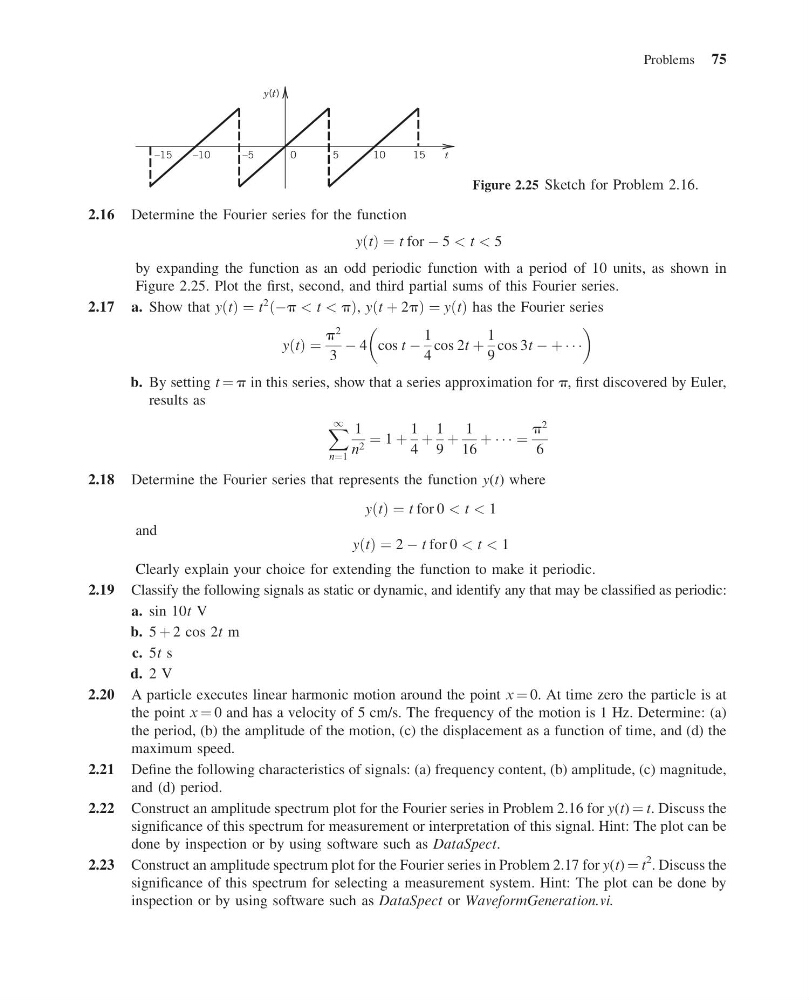
2.16 Determine the Fourier series for the function
y t
ð Þ ¼ t for À 5 < t < 5
by expanding the function as an odd periodic function with a period of 10 units, as shown in
Figure 2.25. Plot the first, second, and third partial sums of this Fourier series.
2.17 a. Show that y t
ð Þ ¼ t
2
Àp < t < p
ð
Þ , y t þ 2p
ð
Þ¼y t
ð Þ has the Fourier series
y t
ð Þ ¼
p
2
3
À 4 cos t À
1
4
cos 2t þ
1
9
cos 3t À þ Á Á Á
b. By setting t ¼ p in this series, show that a series approximation for p, first discovered by Euler,
results as
X 1
n¼1
1
n 2 ¼ 1 þ
1
4
þ
1
9
þ
1
16
þ Á Á Á ¼
p
2
6
2.18 Determine the Fourier series that represents the function y(t) where
y t
ð Þ ¼ t for 0 < t < 1
and
y t
ð Þ ¼ 2 À t for 0 < t < 1
Clearly explain your choice for extending the function to make it periodic.
2.19 Classify the following signals as static or dynamic, and identify any that may be classified as periodic:
a. sin 10t V
b. 5 þ 2 cos 2t m
c. 5t s
d. 2 V
2.20 A particle executes linear harmonic motion around the point x ¼ 0. At time zero the particle is at
the point x ¼ 0 and has a velocity of 5 cm/s. The frequency of the motion is 1 Hz. Determine: (a)
the period, (b) the amplitude of the motion, (c) the displacement as a function of time, and (d) the
maximum speed.
2.21 Define the following characteristics of signals: (a) frequency content, (b) amplitude, (c) magnitude,
and (d) period.
2.22 Construct an amplitude spectrum plot for the Fourier series in Problem 2.16 for y(t) ¼ t. Discuss the
significance of this spectrum for measurement or interpretation of this signal. Hint: The plot can be
done by inspection or by using software such as DataSpect.
2.23 Construct an amplitude spectrum plot for the Fourier series in Problem 2.17 for y(t) ¼ t
2 . Discuss the
significance of this spectrum for selecting a measurement system. Hint: The plot can be done by
inspection or by using software such as DataSpect or WaveformGeneration.vi.
t
15
10
5
0
–5
–10
–15
y(t)
Figure 2.25 Sketch for Problem 2.16.
Problems 75
13:35:23 Page 75
2.16 Determine the Fourier series for the function
y t
ð Þ ¼ t for À 5 < t < 5
by expanding the function as an odd periodic function with a period of 10 units, as shown in
Figure 2.25. Plot the first, second, and third partial sums of this Fourier series.
2.17 a. Show that y t
ð Þ ¼ t
2
Àp < t < p
ð
Þ , y t þ 2p
ð
Þ¼y t
ð Þ has the Fourier series
y t
ð Þ ¼
p
2
3
À 4 cos t À
1
4
cos 2t þ
1
9
cos 3t À þ Á Á Á
b. By setting t ¼ p in this series, show that a series approximation for p, first discovered by Euler,
results as
X 1
n¼1
1
n 2 ¼ 1 þ
1
4
þ
1
9
þ
1
16
þ Á Á Á ¼
p
2
6
2.18 Determine the Fourier series that represents the function y(t) where
y t
ð Þ ¼ t for 0 < t < 1
and
y t
ð Þ ¼ 2 À t for 0 < t < 1
Clearly explain your choice for extending the function to make it periodic.
2.19 Classify the following signals as static or dynamic, and identify any that may be classified as periodic:
a. sin 10t V
b. 5 þ 2 cos 2t m
c. 5t s
d. 2 V
2.20 A particle executes linear harmonic motion around the point x ¼ 0. At time zero the particle is at
the point x ¼ 0 and has a velocity of 5 cm/s. The frequency of the motion is 1 Hz. Determine: (a)
the period, (b) the amplitude of the motion, (c) the displacement as a function of time, and (d) the
maximum speed.
2.21 Define the following characteristics of signals: (a) frequency content, (b) amplitude, (c) magnitude,
and (d) period.
2.22 Construct an amplitude spectrum plot for the Fourier series in Problem 2.16 for y(t) ¼ t. Discuss the
significance of this spectrum for measurement or interpretation of this signal. Hint: The plot can be
done by inspection or by using software such as DataSpect.
2.23 Construct an amplitude spectrum plot for the Fourier series in Problem 2.17 for y(t) ¼ t
2 . Discuss the
significance of this spectrum for selecting a measurement system. Hint: The plot can be done by
inspection or by using software such as DataSpect or WaveformGeneration.vi.
t
15
10
5
0
–5
–10
–15
y(t)
Figure 2.25 Sketch for Problem 2.16.
Problems 75