

E1C02 09/14/2010
13:35:17 Page 50
Nature provides some experiences that support our contention that complex signals can be
represented by the addition of a number of simpler periodic functions. For example, combining a
number of different pure tones can generate rich musical sound. And an excellent physical analogy for
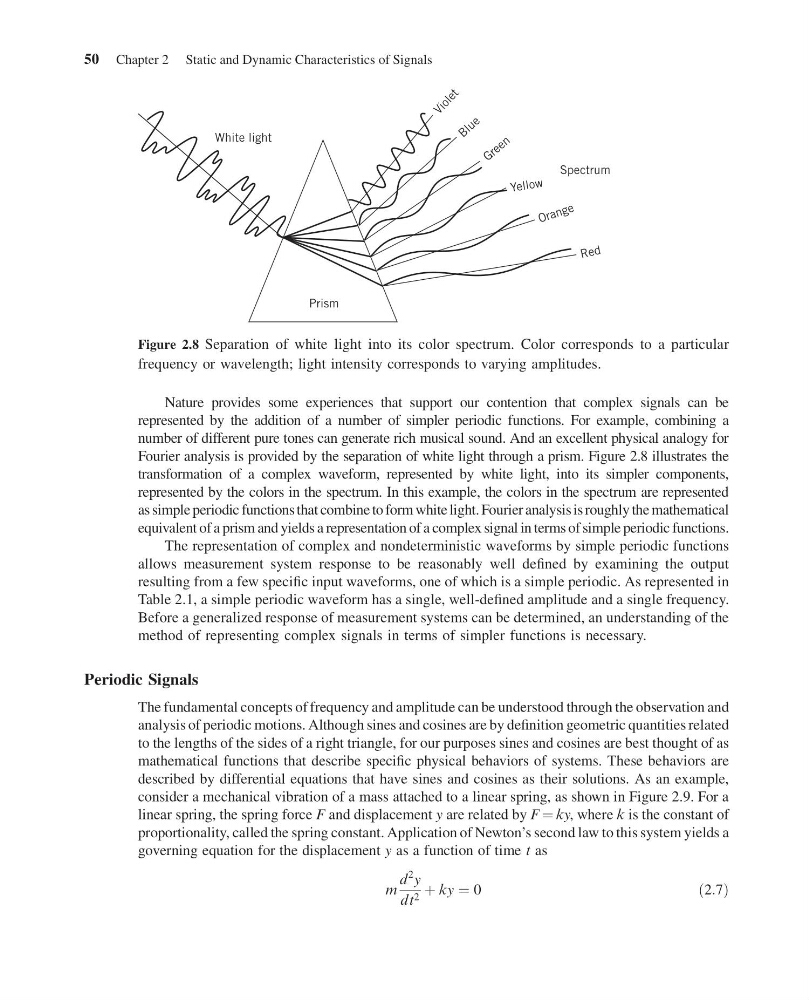
Fourier analysis is provided by the separation of white light through a prism. Figure 2.8 illustrates the
transformation of a complex waveform, represented by white light, into its simpler components,
represented by the colors in the spectrum. In this example, the colors in the spectrum are represented
as simple periodic functions that combine to form white light. Fourier analysis is roughly the mathematical
equivalent of a prism and yields a representation of a complex signal in terms of simple periodic functions.
The representation of complex and nondeterministic waveforms by simple periodic functions
allows measurement system response to be reasonably well defined by examining the output
resulting from a few specific input waveforms, one of which is a simple periodic. As represented in
Table 2.1, a simple periodic waveform has a single, well-defined amplitude and a single frequency.
Before a generalized response of measurement systems can be determined, an understanding of the
method of representing complex signals in terms of simpler functions is necessary.
Periodic Signals
The fundamental concepts of frequency and amplitude can be understood through the observation and
analysis of periodic motions. Although sines and cosines are by definition geometric quantities related
to the lengths of the sides of a right triangle, for our purposes sines and cosines are best thought of as
mathematical functions that describe specific physical behaviors of systems. These behaviors are
described by differential equations that have sines and cosines as their solutions. As an example,
consider a mechanical vibration of a mass attached to a linear spring, as shown in Figure 2.9. For a
linear spring, the spring force F and displacement y are related by F ¼ ky, where k is the constant of
proportionality, called the spring constant. Application of Newton’s second law to this system yields a
governing equation for the displacement y as a function of time t as
m
d
2
y
dt 2 þ ky ¼ 0
ð2:7Þ
White light
Spectrum
V i o l e t
B l u e
G r e e n
Ye llo w
O ra n g e
R ed
Prism
Figure 2.8 Separation of white light into its color spectrum. Color corresponds to a particular
frequency or wavelength; light intensity corresponds to varying amplitudes.
50 Chapter 2 Static and Dynamic Characteristics of Signals
13:35:17 Page 50
Nature provides some experiences that support our contention that complex signals can be
represented by the addition of a number of simpler periodic functions. For example, combining a
number of different pure tones can generate rich musical sound. And an excellent physical analogy for
Fourier analysis is provided by the separation of white light through a prism. Figure 2.8 illustrates the
transformation of a complex waveform, represented by white light, into its simpler components,
represented by the colors in the spectrum. In this example, the colors in the spectrum are represented
as simple periodic functions that combine to form white light. Fourier analysis is roughly the mathematical
equivalent of a prism and yields a representation of a complex signal in terms of simple periodic functions.
The representation of complex and nondeterministic waveforms by simple periodic functions
allows measurement system response to be reasonably well defined by examining the output
resulting from a few specific input waveforms, one of which is a simple periodic. As represented in
Table 2.1, a simple periodic waveform has a single, well-defined amplitude and a single frequency.
Before a generalized response of measurement systems can be determined, an understanding of the
method of representing complex signals in terms of simpler functions is necessary.
Periodic Signals
The fundamental concepts of frequency and amplitude can be understood through the observation and
analysis of periodic motions. Although sines and cosines are by definition geometric quantities related
to the lengths of the sides of a right triangle, for our purposes sines and cosines are best thought of as
mathematical functions that describe specific physical behaviors of systems. These behaviors are
described by differential equations that have sines and cosines as their solutions. As an example,
consider a mechanical vibration of a mass attached to a linear spring, as shown in Figure 2.9. For a
linear spring, the spring force F and displacement y are related by F ¼ ky, where k is the constant of
proportionality, called the spring constant. Application of Newton’s second law to this system yields a
governing equation for the displacement y as a function of time t as
m
d
2
y
dt 2 þ ky ¼ 0
ð2:7Þ
White light
Spectrum
V i o l e t
B l u e
G r e e n
Ye llo w
O ra n g e
R ed
Prism
Figure 2.8 Separation of white light into its color spectrum. Color corresponds to a particular
frequency or wavelength; light intensity corresponds to varying amplitudes.
50 Chapter 2 Static and Dynamic Characteristics of Signals