

E1C10 09/14/2010
13:4:38 Page 439
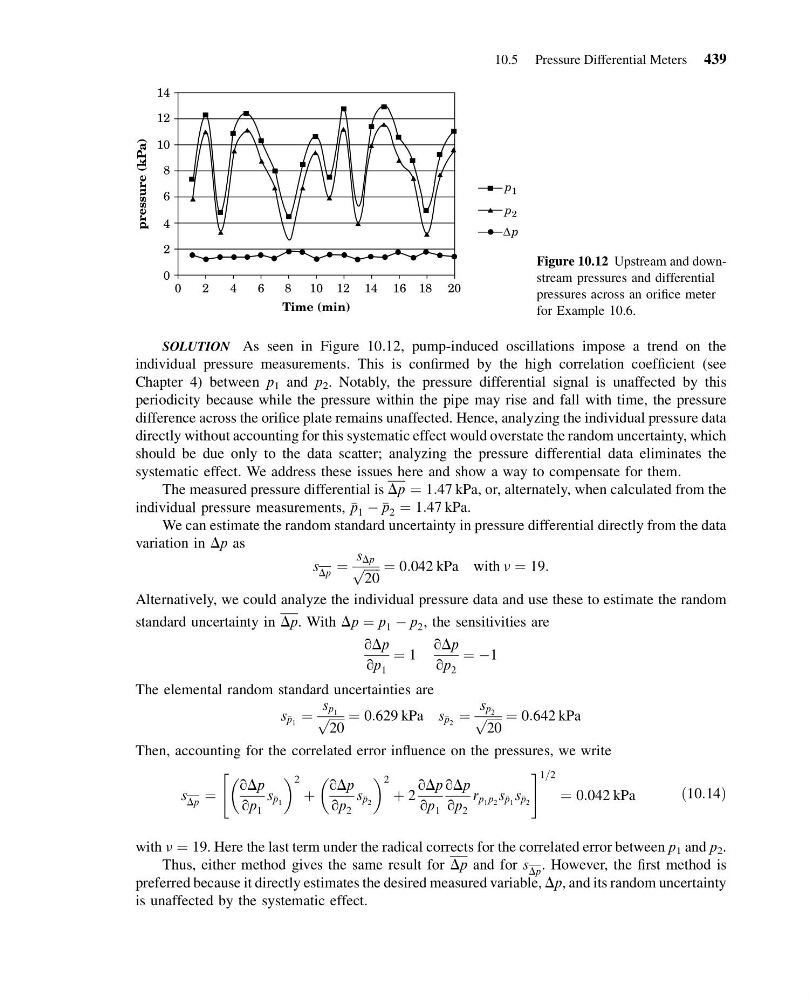
SOLUTION As seen in Figure 10.12, pump-induced oscillations impose a trend on the
individual pressure measurements. This is confirmed by the high correlation coefficient (see
Chapter 4) between p 1 and p 2 . Notably, the pressure differential signal is unaffected by this
periodicity because while the pressure within the pipe may rise and fall with time, the pressure
difference across the orifice plate remains unaffected. Hence, analyzing the individual pressure data
directly without accounting for this systematic effect would overstate the random uncertainty, which
should be due only to the data scatter; analyzing the pressure differential data eliminates the
systematic effect. We address these issues here and show a way to compensate for them.
The measured pressure differential is Dp ¼ 1:47 kPa, or, alternately, when calculated from the
individual pressure measurements, p 1 À p 2 ¼ 1:47 kPa.
We can estimate the random standard uncertainty in pressure differential directly from the data
variation in Dp as
s Dp ¼
s Dp
ffiffiffiffiffi
20
p ¼ 0:042 kPa with n ¼ 19:
Alternatively, we could analyze the individual pressure data and use these to estimate the random
standard uncertainty in Dp. With Dp ¼ p 1 À p 2 , the sensitivities are
qDp
qp 1
¼ 1
qDp
qp 2
¼ À1
The elemental random standard uncertainties are
s p 1 ¼
s p 1
ffiffiffiffiffi
20
p ¼ 0:629 kPa s p 2 ¼
s p 2
ffiffiffiffiffi
20
p ¼ 0:642 kPa
Then, accounting for the correlated error influence on the pressures, we write
s Dp ¼
qDp
qp 1
s p 1
2
þ
qDp
qp 2
s p 2
2
þ 2
qDp
qp 1
qDp
qp 2
r p 1 p 2 s p 1 s p 2
"
# 1=2
¼ 0:042 kPa
ð10:14Þ
with n ¼ 19. Here the last term under the radical corrects for the correlated error between p 1 and p 2 .
Thus, either method gives the same result for Dp and for s Dp . However, the first method is
preferred because it directly estimates the desired measured variable, Dp, and its random uncertainty
is unaffected by the systematic effect.
14
12
10
pressure (kPa)
8
6
4
2
0
0
2
4
6
8
10
Time (min)
12 14 16 18 20
p 2
p 1
Δ p
Figure 10.12 Upstream and downstream pressures and differential
pressures across an orifice meter
for Example 10.6.
10.5 Pressure Differential Meters 439
13:4:38 Page 439
SOLUTION As seen in Figure 10.12, pump-induced oscillations impose a trend on the
individual pressure measurements. This is confirmed by the high correlation coefficient (see
Chapter 4) between p 1 and p 2 . Notably, the pressure differential signal is unaffected by this
periodicity because while the pressure within the pipe may rise and fall with time, the pressure
difference across the orifice plate remains unaffected. Hence, analyzing the individual pressure data
directly without accounting for this systematic effect would overstate the random uncertainty, which
should be due only to the data scatter; analyzing the pressure differential data eliminates the
systematic effect. We address these issues here and show a way to compensate for them.
The measured pressure differential is Dp ¼ 1:47 kPa, or, alternately, when calculated from the
individual pressure measurements, p 1 À p 2 ¼ 1:47 kPa.
We can estimate the random standard uncertainty in pressure differential directly from the data
variation in Dp as
s Dp ¼
s Dp
ffiffiffiffiffi
20
p ¼ 0:042 kPa with n ¼ 19:
Alternatively, we could analyze the individual pressure data and use these to estimate the random
standard uncertainty in Dp. With Dp ¼ p 1 À p 2 , the sensitivities are
qDp
qp 1
¼ 1
qDp
qp 2
¼ À1
The elemental random standard uncertainties are
s p 1 ¼
s p 1
ffiffiffiffiffi
20
p ¼ 0:629 kPa s p 2 ¼
s p 2
ffiffiffiffiffi
20
p ¼ 0:642 kPa
Then, accounting for the correlated error influence on the pressures, we write
s Dp ¼
qDp
qp 1
s p 1
2
þ
qDp
qp 2
s p 2
2
þ 2
qDp
qp 1
qDp
qp 2
r p 1 p 2 s p 1 s p 2
"
# 1=2
¼ 0:042 kPa
ð10:14Þ
with n ¼ 19. Here the last term under the radical corrects for the correlated error between p 1 and p 2 .
Thus, either method gives the same result for Dp and for s Dp . However, the first method is
preferred because it directly estimates the desired measured variable, Dp, and its random uncertainty
is unaffected by the systematic effect.
14
12
10
pressure (kPa)
8
6
4
2
0
0
2
4
6
8
10
Time (min)
12 14 16 18 20
p 2
p 1
Δ p
Figure 10.12 Upstream and downstream pressures and differential
pressures across an orifice meter
for Example 10.6.
10.5 Pressure Differential Meters 439