

E1C10 09/14/2010
13:4:37 Page 426
measurement position. There are several options in selecting measuring positions for differentshaped ducts, and such details are specified in available engineering test standards (1, 2, 4, 15). The
simplest method is to divide the flow area into smaller equal areas, making measurements at the
centroid of each small area and assigning the measured velocity to that area. Regardless of the option
selected, the average flow rate is estimated along each cross section traversed using Equation 10.2
and the pooled mean of the flow rates for the m cross sections calculated to yield the best estimate of
the duct flow rate. Uncertainty is assessed both by repeating the measurements and by analyzing for
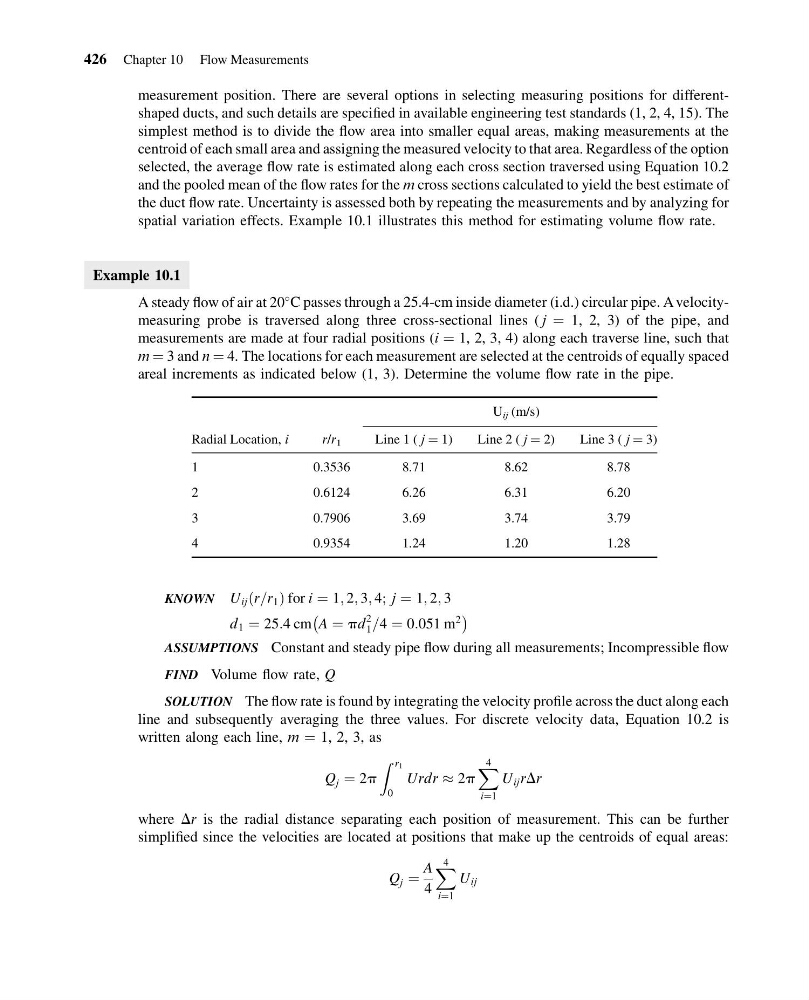
spatial variation effects. Example 10.1 illustrates this method for estimating volume flow rate.
Example 10.1
A steady flow of air at 20
C passes through a 25.4-cm inside diameter (i.d.) circular pipe. A velocitymeasuring probe is traversed along three cross-sectional lines ( j ¼ 1, 2, 3) of the pipe, and
measurements are made at four radial positions (i ¼ 1, 2, 3, 4) along each traverse line, such that
m ¼ 3 and n ¼ 4. The locations for each measurement are selected at the centroids of equally spaced
areal increments as indicated below (1, 3). Determine the volume flow rate in the pipe.
U ij (m/s)
Radial Location, i
r/r 1
Line 1 ( j ¼ 1)
Line 2 ( j ¼ 2)
Line 3 ( j ¼ 3)
1
0.3536
8.71
8.62
8.78
2
0.6124
6.26
6.31
6.20
3
0.7906
3.69
3.74
3.79
4
0.9354
1.24
1.20
1.28
KNOWN U ij r=r 1
ð
Þfor i ¼ 1; 2; 3; 4; j ¼ 1; 2; 3
d 1 ¼ 25:4 cm A ¼ pd
2
1 =4 ¼ 0:051 m
2
À
Á
ASSUMPTIONS Constant and steady pipe flow during all measurements; Incompressible flow
FIND Volume flow rate, Q
SOLUTION The flow rate is found by integrating the velocity profile across the duct along each
line and subsequently averaging the three values. For discrete velocity data, Equation 10.2 is
written along each line, m ¼ 1, 2, 3, as
Q j ¼ 2p
Z r 1
0
Urdr % 2p
X 4
i¼1
U ij rDr
where Dr is the radial distance separating each position of measurement. This can be further
simplified since the velocities are located at positions that make up the centroids of equal areas:
Q j ¼
A
4
X 4
i¼1
U ij
426 Chapter 10 Flow Measurements
13:4:37 Page 426
measurement position. There are several options in selecting measuring positions for differentshaped ducts, and such details are specified in available engineering test standards (1, 2, 4, 15). The
simplest method is to divide the flow area into smaller equal areas, making measurements at the
centroid of each small area and assigning the measured velocity to that area. Regardless of the option
selected, the average flow rate is estimated along each cross section traversed using Equation 10.2
and the pooled mean of the flow rates for the m cross sections calculated to yield the best estimate of
the duct flow rate. Uncertainty is assessed both by repeating the measurements and by analyzing for
spatial variation effects. Example 10.1 illustrates this method for estimating volume flow rate.
Example 10.1
A steady flow of air at 20
C passes through a 25.4-cm inside diameter (i.d.) circular pipe. A velocitymeasuring probe is traversed along three cross-sectional lines ( j ¼ 1, 2, 3) of the pipe, and
measurements are made at four radial positions (i ¼ 1, 2, 3, 4) along each traverse line, such that
m ¼ 3 and n ¼ 4. The locations for each measurement are selected at the centroids of equally spaced
areal increments as indicated below (1, 3). Determine the volume flow rate in the pipe.
U ij (m/s)
Radial Location, i
r/r 1
Line 1 ( j ¼ 1)
Line 2 ( j ¼ 2)
Line 3 ( j ¼ 3)
1
0.3536
8.71
8.62
8.78
2
0.6124
6.26
6.31
6.20
3
0.7906
3.69
3.74
3.79
4
0.9354
1.24
1.20
1.28
KNOWN U ij r=r 1
ð
Þfor i ¼ 1; 2; 3; 4; j ¼ 1; 2; 3
d 1 ¼ 25:4 cm A ¼ pd
2
1 =4 ¼ 0:051 m
2
À
Á
ASSUMPTIONS Constant and steady pipe flow during all measurements; Incompressible flow
FIND Volume flow rate, Q
SOLUTION The flow rate is found by integrating the velocity profile across the duct along each
line and subsequently averaging the three values. For discrete velocity data, Equation 10.2 is
written along each line, m ¼ 1, 2, 3, as
Q j ¼ 2p
Z r 1
0
Urdr % 2p
X 4
i¼1
U ij rDr
where Dr is the radial distance separating each position of measurement. This can be further
simplified since the velocities are located at positions that make up the centroids of equal areas:
Q j ¼
A
4
X 4
i¼1
U ij
426 Chapter 10 Flow Measurements