

E1C09 09/14/2010
15:4:54 Page 399
digital (A/D) converter (accuracy: 2 LSB). In testing at 180 km/hr, the maximum average pressure
difference between the rear deck and underbody is about 8 cm H 2 O Æ 0.10 cm H 2 O (95%). The
engineer is asked two questions: (1) Will increasing the resolution of the A/D conversion system
reduce the measured uncertainty in pressure? (2) How well can rear downforce be measured on the
track?
SOLUTION Aerodynamic downforce is determined by integrating the pressure over
the surface area of the car. An approximation is to use average pressures acting on discrete
effective areas on the car surface, such as on the upper and lower rear deck.
If we ignore installation errors and ambient influences and just look at direct measurement
errors, the measurement system errors and data random errors are important. The resolution of the
transducer and A/D system is limited to
Q transducer ¼ 50:8 cm H 2 O=5 V ¼ 10:16 cm H 2 O=V
Q A=D ¼ 5 V=2
12
¼ 0:00122 V=digit;
giving the total measuring system resolution of
Q ¼ 0:00122 Â 10:16 ¼ 0:0124 cm H 2 O
So we assign u o ¼ 0.0124 cm H 2 O. However, improving the data-acquisition system (DAS) to a 16bit system improves Q and thereby u o to 0.008 cm H 2 O.
(b)
(a)
p
e /p
v [%]
–3
–2
–1
0
+1
+2
+3
+4
28
4
24
8
20
12
16
16
12
20
8
24
4
28
x s /D
x h /D
Leading edge effects
Support stem effects
x h
x s
8 Taps
Support stem
To
transducer
Flow
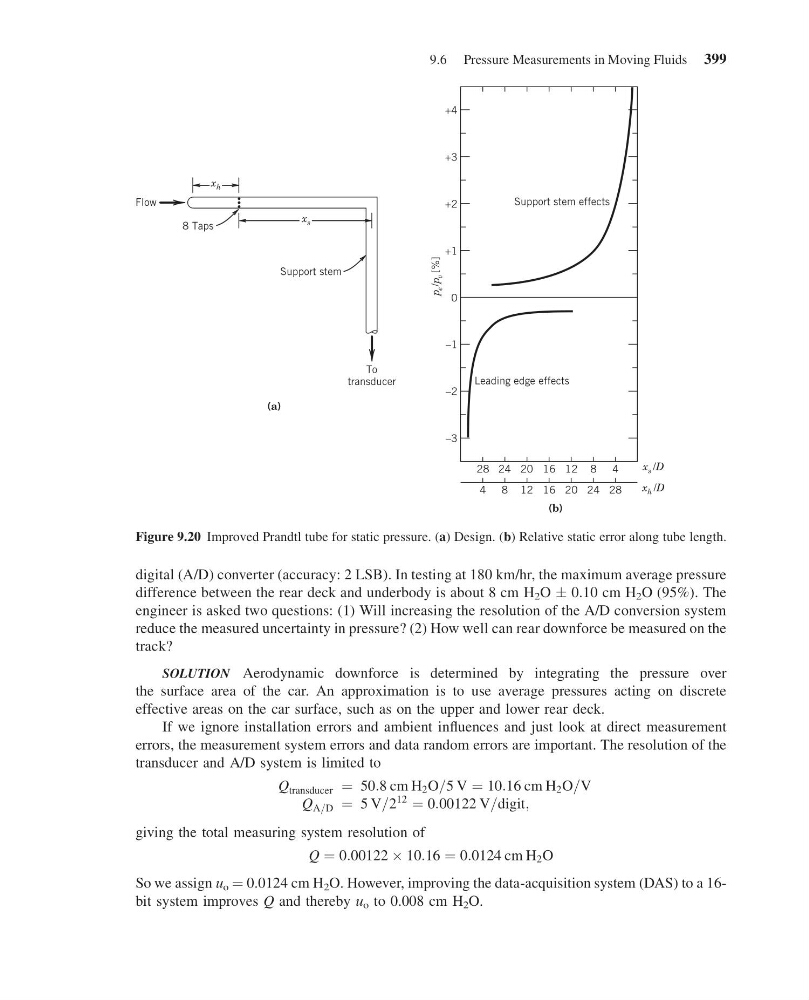
Figure 9.20 Improved Prandtl tube for static pressure. (a) Design. (b) Relative static error along tube length.
9.6 Pressure Measurements in Moving Fluids 399
15:4:54 Page 399
digital (A/D) converter (accuracy: 2 LSB). In testing at 180 km/hr, the maximum average pressure
difference between the rear deck and underbody is about 8 cm H 2 O Æ 0.10 cm H 2 O (95%). The
engineer is asked two questions: (1) Will increasing the resolution of the A/D conversion system
reduce the measured uncertainty in pressure? (2) How well can rear downforce be measured on the
track?
SOLUTION Aerodynamic downforce is determined by integrating the pressure over
the surface area of the car. An approximation is to use average pressures acting on discrete
effective areas on the car surface, such as on the upper and lower rear deck.
If we ignore installation errors and ambient influences and just look at direct measurement
errors, the measurement system errors and data random errors are important. The resolution of the
transducer and A/D system is limited to
Q transducer ¼ 50:8 cm H 2 O=5 V ¼ 10:16 cm H 2 O=V
Q A=D ¼ 5 V=2
12
¼ 0:00122 V=digit;
giving the total measuring system resolution of
Q ¼ 0:00122 Â 10:16 ¼ 0:0124 cm H 2 O
So we assign u o ¼ 0.0124 cm H 2 O. However, improving the data-acquisition system (DAS) to a 16bit system improves Q and thereby u o to 0.008 cm H 2 O.
(b)
(a)
p
e /p
v [%]
–3
–2
–1
0
+1
+2
+3
+4
28
4
24
8
20
12
16
16
12
20
8
24
4
28
x s /D
x h /D
Leading edge effects
Support stem effects
x h
x s
8 Taps
Support stem
To
transducer
Flow
Figure 9.20 Improved Prandtl tube for static pressure. (a) Design. (b) Relative static error along tube length.
9.6 Pressure Measurements in Moving Fluids 399