

E1C08 09/14/2010
14:53:57 Page 330
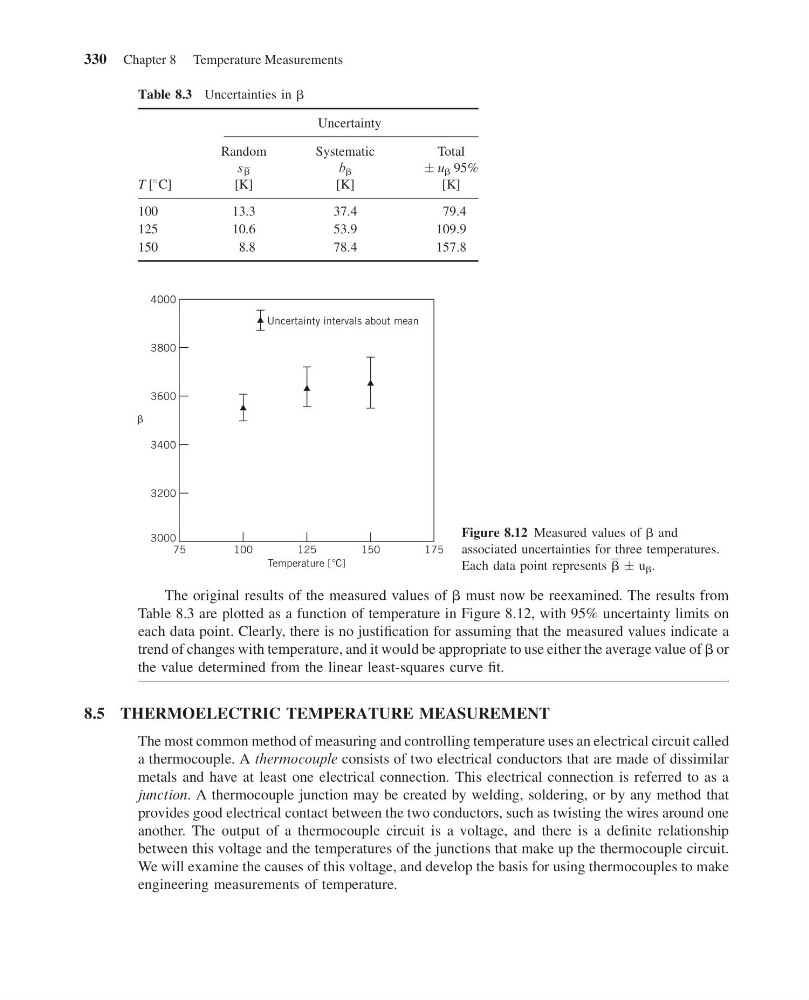
The original results of the measured values of b must now be reexamined. The results from
Table 8.3 are plotted as a function of temperature in Figure 8.12, with 95% uncertainty limits on
each data point. Clearly, there is no justification for assuming that the measured values indicate a
trend of changes with temperature, and it would be appropriate to use either the average value of b or
the value determined from the linear least-squares curve fit.
8.5 THERMOELECTRIC TEMPERATURE MEASUREMENT
The most common method of measuring and controlling temperature uses an electrical circuit called
a thermocouple. A thermocouple consists of two electrical conductors that are made of dissimilar
metals and have at least one electrical connection. This electrical connection is referred to as a
junction. A thermocouple junction may be created by welding, soldering, or by any method that
provides good electrical contact between the two conductors, such as twisting the wires around one
another. The output of a thermocouple circuit is a voltage, and there is a definite relationship
between this voltage and the temperatures of the junctions that make up the thermocouple circuit.
We will examine the causes of this voltage, and develop the basis for using thermocouples to make
engineering measurements of temperature.
Table 8.3 Uncertainties in b
Uncertainty
T [
C]
Random
s b
[K]
Systematic
b b
[K]
Total
Æ u b 95%
[K]
100
13.3
37.4
79.4
125
10.6
53.9
109.9
150
8.8
78.4
157.8
175
150
125
100
75
Temperature [ C]
3000
Uncertainty intervals about mean
3200
3400
3600
3800
4000
Figure 8.12 Measured values of b and
associated uncertainties for three temperatures.
Each data point represents b Æ u b .
330 Chapter 8 Temperature Measurements
14:53:57 Page 330
The original results of the measured values of b must now be reexamined. The results from
Table 8.3 are plotted as a function of temperature in Figure 8.12, with 95% uncertainty limits on
each data point. Clearly, there is no justification for assuming that the measured values indicate a
trend of changes with temperature, and it would be appropriate to use either the average value of b or
the value determined from the linear least-squares curve fit.
8.5 THERMOELECTRIC TEMPERATURE MEASUREMENT
The most common method of measuring and controlling temperature uses an electrical circuit called
a thermocouple. A thermocouple consists of two electrical conductors that are made of dissimilar
metals and have at least one electrical connection. This electrical connection is referred to as a
junction. A thermocouple junction may be created by welding, soldering, or by any method that
provides good electrical contact between the two conductors, such as twisting the wires around one
another. The output of a thermocouple circuit is a voltage, and there is a definite relationship
between this voltage and the temperatures of the junctions that make up the thermocouple circuit.
We will examine the causes of this voltage, and develop the basis for using thermocouples to make
engineering measurements of temperature.
Table 8.3 Uncertainties in b
Uncertainty
T [
C]
Random
s b
[K]
Systematic
b b
[K]
Total
Æ u b 95%
[K]
100
13.3
37.4
79.4
125
10.6
53.9
109.9
150
8.8
78.4
157.8
175
150
125
100
75
Temperature [ C]
3000
Uncertainty intervals about mean
3200
3400
3600
3800
4000
Figure 8.12 Measured values of b and
associated uncertainties for three temperatures.
Each data point represents b Æ u b .
330 Chapter 8 Temperature Measurements