

E1C07 09/14/2010
14:43:48 Page 264
for r ¼ 0, 1, . . . , NÀ1 can be rewritten as
fy rdt
ð Þg ¼
X 1
n¼1
C n sin 2p nf þ
nm
dt
rdt þ f n f
ð Þ
h
i
ð7:8Þ
and so it displays the same aliasing phenomenon shown in Equation 7.6. In general, the Nyquist
frequency defined by
f N ¼
f s
2
¼
1
2dt
ð7:9Þ
represents a folding point for the aliasing phenomenon. All frequency content in the analog signal
that is at frequencies above f N appears as alias frequencies of less than f N in the sampled signal. That
is, such frequencies are folded back and superimposed on the signal as lower frequencies. The
aliasing phenomenon occurs in spatial sampling [i.e., y(x) at sampling intervals dx] as well, and the
above discussion applies equally.
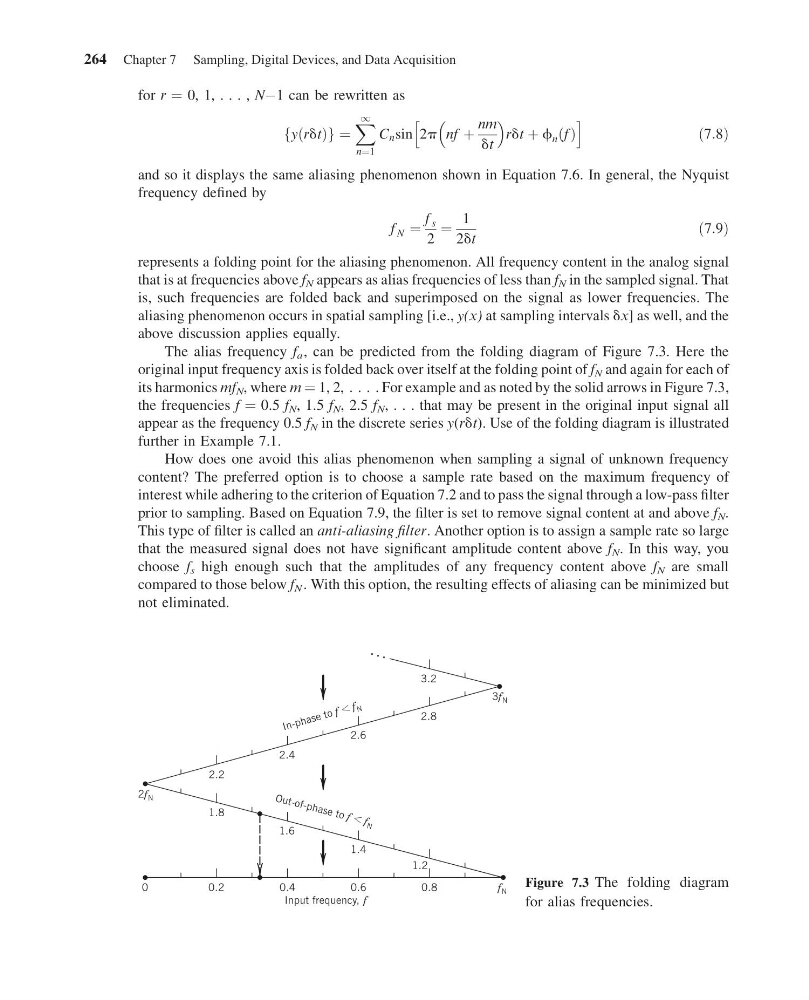
The alias frequency f a , can be predicted from the folding diagram of Figure 7.3. Here the
original input frequency axis is folded back over itself at the folding point of f N and again for each of
its harmonics mf N , where m ¼ 1, 2, . . . . For example and as noted by the solid arrows in Figure 7.3,
the frequencies f ¼ 0.5 f N , 1.5 f N , 2.5 f N , . . . that may be present in the original input signal all
appear as the frequency 0.5 f N in the discrete series y(rdt). Use of the folding diagram is illustrated
further in Example 7.1.
How does one avoid this alias phenomenon when sampling a signal of unknown frequency
content? The preferred option is to choose a sample rate based on the maximum frequency of
interest while adhering to the criterion of Equation 7.2 and to pass the signal through a low-pass filter
prior to sampling. Based on Equation 7.9, the filter is set to remove signal content at and above f N .
This type of filter is called an anti-aliasing filter. Another option is to assign a sample rate so large
that the measured signal does not have significant amplitude content above f N . In this way, you
choose f s high enough such that the amplitudes of any frequency content above f N are small
compared to those below f N . With this option, the resulting effects of aliasing can be minimized but
not eliminated.
0.8
f N
1.2
2.8
. . .
3.2
3f N
0.6
Input frequency, f
O ut -o f- ph as e to f f N
In -p h as e to f f N
1.4
2.6
0.4
1.6
2.4
0.2
1.8
2.2
0
2f N
Figure 7.3 The folding diagram
for alias frequencies.
264 Chapter 7 Sampling, Digital Devices, and Data Acquisition
14:43:48 Page 264
for r ¼ 0, 1, . . . , NÀ1 can be rewritten as
fy rdt
ð Þg ¼
X 1
n¼1
C n sin 2p nf þ
nm
dt
rdt þ f n f
ð Þ
h
i
ð7:8Þ
and so it displays the same aliasing phenomenon shown in Equation 7.6. In general, the Nyquist
frequency defined by
f N ¼
f s
2
¼
1
2dt
ð7:9Þ
represents a folding point for the aliasing phenomenon. All frequency content in the analog signal
that is at frequencies above f N appears as alias frequencies of less than f N in the sampled signal. That
is, such frequencies are folded back and superimposed on the signal as lower frequencies. The
aliasing phenomenon occurs in spatial sampling [i.e., y(x) at sampling intervals dx] as well, and the
above discussion applies equally.
The alias frequency f a , can be predicted from the folding diagram of Figure 7.3. Here the
original input frequency axis is folded back over itself at the folding point of f N and again for each of
its harmonics mf N , where m ¼ 1, 2, . . . . For example and as noted by the solid arrows in Figure 7.3,
the frequencies f ¼ 0.5 f N , 1.5 f N , 2.5 f N , . . . that may be present in the original input signal all
appear as the frequency 0.5 f N in the discrete series y(rdt). Use of the folding diagram is illustrated
further in Example 7.1.
How does one avoid this alias phenomenon when sampling a signal of unknown frequency
content? The preferred option is to choose a sample rate based on the maximum frequency of
interest while adhering to the criterion of Equation 7.2 and to pass the signal through a low-pass filter
prior to sampling. Based on Equation 7.9, the filter is set to remove signal content at and above f N .
This type of filter is called an anti-aliasing filter. Another option is to assign a sample rate so large
that the measured signal does not have significant amplitude content above f N . In this way, you
choose f s high enough such that the amplitudes of any frequency content above f N are small
compared to those below f N . With this option, the resulting effects of aliasing can be minimized but
not eliminated.
0.8
f N
1.2
2.8
. . .
3.2
3f N
0.6
Input frequency, f
O ut -o f- ph as e to f f N
In -p h as e to f f N
1.4
2.6
0.4
1.6
2.4
0.2
1.8
2.2
0
2f N
Figure 7.3 The folding diagram
for alias frequencies.
264 Chapter 7 Sampling, Digital Devices, and Data Acquisition