

E1C05 09/14/2010
14:36:33 Page 208
5.54 A geometric stress concentration factor, K t , is used to relate the actual maximum stress to a welldefined nominal stress in a structural member. The maximum stress is given by s max ¼ K t s o , where
s max represents the maximum stress and s o represents the nominal stress. The nominal stress is most
often stated at the minimum cross section.
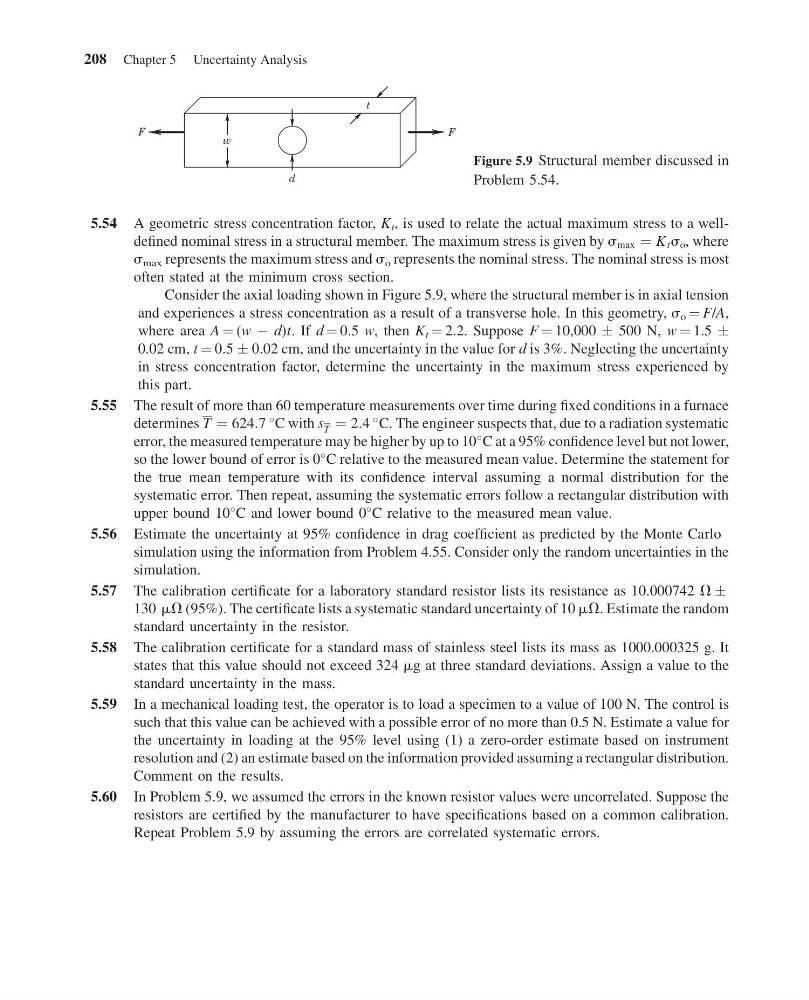
Consider the axial loading shown in Figure 5.9, where the structural member is in axial tension
and experiences a stress concentration as a result of a transverse hole. In this geometry, s o ¼ F/A,
where area A ¼ (w À d)t. If d ¼ 0.5 w, then K t ¼ 2.2. Suppose F ¼ 10,000 Æ 500 N, w ¼ 1.5 Æ
0.02 cm, t ¼ 0.5 Æ 0.02 cm, and the uncertainty in the value for d is 3%. Neglecting the uncertainty
in stress concentration factor, determine the uncertainty in the maximum stress experienced by
this part.
5.55 The result of more than 60 temperature measurements over time during fixed conditions in a furnace
determines T ¼ 624:7
C with s T ¼ 2:4
C. The engineer suspects that, due to a radiation systematic
error, the measured temperature may be higher by up to 10
C at a 95% confidence level but not lower,
so the lower bound of error is 0
C relative to the measured mean value. Determine the statement for
the true mean temperature with its confidence interval assuming a normal distribution for the
systematic error. Then repeat, assuming the systematic errors follow a rectangular distribution with
upper bound 10
C and lower bound 0
C relative to the measured mean value.
5.56 Estimate the uncertainty at 95% confidence in drag coefficient as predicted by the Monte Carlo
simulation using the information from Problem 4.55. Consider only the random uncertainties in the
simulation.
5.57 The calibration certificate for a laboratory standard resistor lists its resistance as 10.000742 V Æ
130 mV (95%). The certificate lists a systematic standard uncertainty of 10 mV. Estimate the random
standard uncertainty in the resistor.
5.58 The calibration certificate for a standard mass of stainless steel lists its mass as 1000.000325 g. It
states that this value should not exceed 324 mg at three standard deviations. Assign a value to the
standard uncertainty in the mass.
5.59 In a mechanical loading test, the operator is to load a specimen to a value of 100 N. The control is
such that this value can be achieved with a possible error of no more than 0.5 N. Estimate a value for
the uncertainty in loading at the 95% level using (1) a zero-order estimate based on instrument
resolution and (2) an estimate based on the information provided assuming a rectangular distribution.
Comment on the results.
5.60 In Problem 5.9, we assumed the errors in the known resistor values were uncorrelated. Suppose the
resistors are certified by the manufacturer to have specifications based on a common calibration.
Repeat Problem 5.9 by assuming the errors are correlated systematic errors.
t
d
w
F
F
Figure 5.9 Structural member discussed in
Problem 5.54.
208 Chapter 5 Uncertainty Analysis
14:36:33 Page 208
5.54 A geometric stress concentration factor, K t , is used to relate the actual maximum stress to a welldefined nominal stress in a structural member. The maximum stress is given by s max ¼ K t s o , where
s max represents the maximum stress and s o represents the nominal stress. The nominal stress is most
often stated at the minimum cross section.
Consider the axial loading shown in Figure 5.9, where the structural member is in axial tension
and experiences a stress concentration as a result of a transverse hole. In this geometry, s o ¼ F/A,
where area A ¼ (w À d)t. If d ¼ 0.5 w, then K t ¼ 2.2. Suppose F ¼ 10,000 Æ 500 N, w ¼ 1.5 Æ
0.02 cm, t ¼ 0.5 Æ 0.02 cm, and the uncertainty in the value for d is 3%. Neglecting the uncertainty
in stress concentration factor, determine the uncertainty in the maximum stress experienced by
this part.
5.55 The result of more than 60 temperature measurements over time during fixed conditions in a furnace
determines T ¼ 624:7
C with s T ¼ 2:4
C. The engineer suspects that, due to a radiation systematic
error, the measured temperature may be higher by up to 10
C at a 95% confidence level but not lower,
so the lower bound of error is 0
C relative to the measured mean value. Determine the statement for
the true mean temperature with its confidence interval assuming a normal distribution for the
systematic error. Then repeat, assuming the systematic errors follow a rectangular distribution with
upper bound 10
C and lower bound 0
C relative to the measured mean value.
5.56 Estimate the uncertainty at 95% confidence in drag coefficient as predicted by the Monte Carlo
simulation using the information from Problem 4.55. Consider only the random uncertainties in the
simulation.
5.57 The calibration certificate for a laboratory standard resistor lists its resistance as 10.000742 V Æ
130 mV (95%). The certificate lists a systematic standard uncertainty of 10 mV. Estimate the random
standard uncertainty in the resistor.
5.58 The calibration certificate for a standard mass of stainless steel lists its mass as 1000.000325 g. It
states that this value should not exceed 324 mg at three standard deviations. Assign a value to the
standard uncertainty in the mass.
5.59 In a mechanical loading test, the operator is to load a specimen to a value of 100 N. The control is
such that this value can be achieved with a possible error of no more than 0.5 N. Estimate a value for
the uncertainty in loading at the 95% level using (1) a zero-order estimate based on instrument
resolution and (2) an estimate based on the information provided assuming a rectangular distribution.
Comment on the results.
5.60 In Problem 5.9, we assumed the errors in the known resistor values were uncorrelated. Suppose the
resistors are certified by the manufacturer to have specifications based on a common calibration.
Repeat Problem 5.9 by assuming the errors are correlated systematic errors.
t
d
w
F
F
Figure 5.9 Structural member discussed in
Problem 5.54.
208 Chapter 5 Uncertainty Analysis