

E1C05 09/14/2010
14:36:33 Page 204
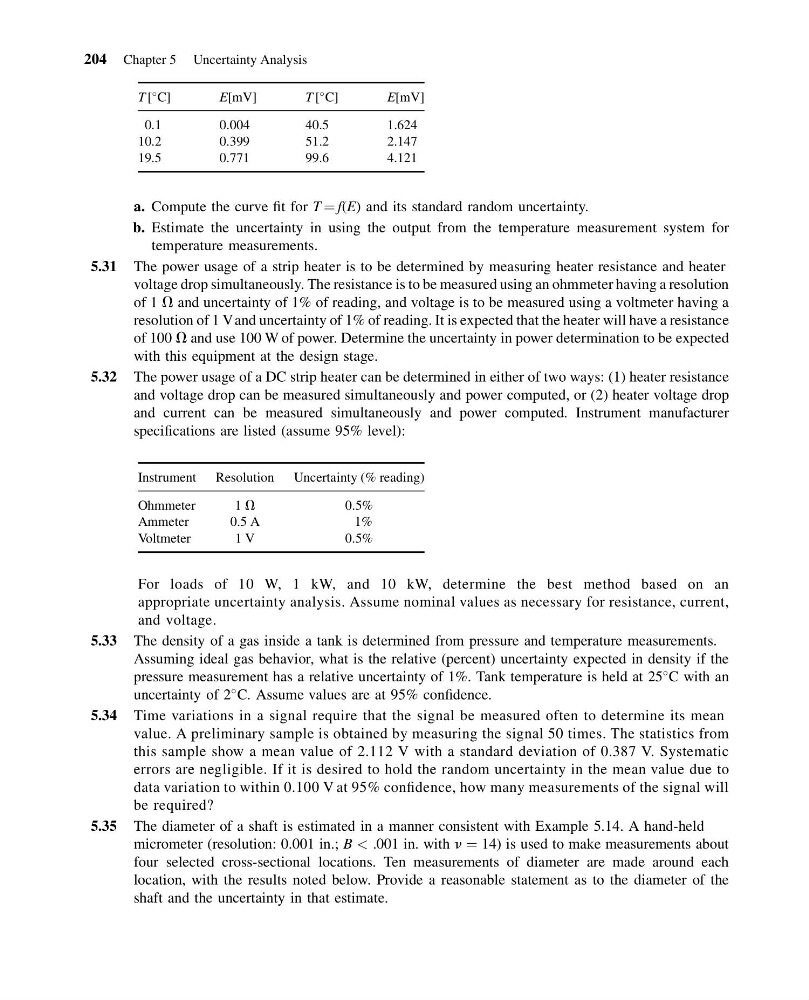
T [
C]
E[mV]
T [
C]
E[mV]
0.1
0.004
40.5
1.624
10.2
0.399
51.2
2.147
19.5
0.771
99.6
4.121
a. Compute the curve fit for T ¼ f(E) and its standard random uncertainty.
b. Estimate the uncertainty in using the output from the temperature measurement system for
temperature measurements.
5.31 The power usage of a strip heater is to be determined by measuring heater resistance and heater
voltage drop simultaneously. The resistance is to be measured using an ohmmeter having a resolution
of 1 V and uncertainty of 1% of reading, and voltage is to be measured using a voltmeter having a
resolution of 1 Vand uncertainty of 1% of reading. It is expected that the heater will have a resistance
of 100 V and use 100 W of power. Determine the uncertainty in power determination to be expected
with this equipment at the design stage.
5.32 The power usage of a DC strip heater can be determined in either of two ways: (1) heater resistance
and voltage drop can be measured simultaneously and power computed, or (2) heater voltage drop
and current can be measured simultaneously and power computed. Instrument manufacturer
specifications are listed (assume 95% level):
Instrument Resolution Uncertainty (% reading)
Ohmmeter
1 V
0.5%
Ammeter
0.5 A
1%
Voltmeter
1 V
0.5%
For loads of 10 W, 1 kW, and 10 kW, determine the best method based on an
appropriate uncertainty analysis. Assume nominal values as necessary for resistance, current,
and voltage.
5.33 The density of a gas inside a tank is determined from pressure and temperature measurements.
Assuming ideal gas behavior, what is the relative (percent) uncertainty expected in density if the
pressure measurement has a relative uncertainty of 1%. Tank temperature is held at 25
C with an
uncertainty of 2
C. Assume values are at 95% confidence.
5.34 Time variations in a signal require that the signal be measured often to determine its mean
value. A preliminary sample is obtained by measuring the signal 50 times. The statistics from
this sample show a mean value of 2.112 V with a standard deviation of 0.387 V. Systematic
errors are negligible. If it is desired to hold the random uncertainty in the mean value due to
data variation to within 0.100 V at 95% confidence, how many measurements of the signal will
be required?
5.35 The diameter of a shaft is estimated in a manner consistent with Example 5.14. A hand-held
micrometer (resolution: 0.001 in.; B < .001 in. with n ¼ 14) is used to make measurements about
four selected cross-sectional locations. Ten measurements of diameter are made around each
location, with the results noted below. Provide a reasonable statement as to the diameter of the
shaft and the uncertainty in that estimate.
204 Chapter 5 Uncertainty Analysis
14:36:33 Page 204
T [
C]
E[mV]
T [
C]
E[mV]
0.1
0.004
40.5
1.624
10.2
0.399
51.2
2.147
19.5
0.771
99.6
4.121
a. Compute the curve fit for T ¼ f(E) and its standard random uncertainty.
b. Estimate the uncertainty in using the output from the temperature measurement system for
temperature measurements.
5.31 The power usage of a strip heater is to be determined by measuring heater resistance and heater
voltage drop simultaneously. The resistance is to be measured using an ohmmeter having a resolution
of 1 V and uncertainty of 1% of reading, and voltage is to be measured using a voltmeter having a
resolution of 1 Vand uncertainty of 1% of reading. It is expected that the heater will have a resistance
of 100 V and use 100 W of power. Determine the uncertainty in power determination to be expected
with this equipment at the design stage.
5.32 The power usage of a DC strip heater can be determined in either of two ways: (1) heater resistance
and voltage drop can be measured simultaneously and power computed, or (2) heater voltage drop
and current can be measured simultaneously and power computed. Instrument manufacturer
specifications are listed (assume 95% level):
Instrument Resolution Uncertainty (% reading)
Ohmmeter
1 V
0.5%
Ammeter
0.5 A
1%
Voltmeter
1 V
0.5%
For loads of 10 W, 1 kW, and 10 kW, determine the best method based on an
appropriate uncertainty analysis. Assume nominal values as necessary for resistance, current,
and voltage.
5.33 The density of a gas inside a tank is determined from pressure and temperature measurements.
Assuming ideal gas behavior, what is the relative (percent) uncertainty expected in density if the
pressure measurement has a relative uncertainty of 1%. Tank temperature is held at 25
C with an
uncertainty of 2
C. Assume values are at 95% confidence.
5.34 Time variations in a signal require that the signal be measured often to determine its mean
value. A preliminary sample is obtained by measuring the signal 50 times. The statistics from
this sample show a mean value of 2.112 V with a standard deviation of 0.387 V. Systematic
errors are negligible. If it is desired to hold the random uncertainty in the mean value due to
data variation to within 0.100 V at 95% confidence, how many measurements of the signal will
be required?
5.35 The diameter of a shaft is estimated in a manner consistent with Example 5.14. A hand-held
micrometer (resolution: 0.001 in.; B < .001 in. with n ¼ 14) is used to make measurements about
four selected cross-sectional locations. Ten measurements of diameter are made around each
location, with the results noted below. Provide a reasonable statement as to the diameter of the
shaft and the uncertainty in that estimate.
204 Chapter 5 Uncertainty Analysis