

E1C05 09/14/2010
14:36:26 Page 170
5.5 SYSTEMATIC AND RANDOM ERRORS
Systematic Error
A systematic error
2 remains constant in repeated measurements under fixed operating conditions. A
systematic error may cause either a high or a low offset in the estimate of the true value of the
measured variable. Because its effect is constant, it can be difficult to estimate the value of a
systematic error or in many cases even recognize its presence. Accordingly, an estimate of the range
of systematic error is represented by an interval, defined as Æb. The value b is the estimate of the
systematic standard uncertainty. Its interval has a confidence level of one standard deviation,
equivalent to a probability level of 68% for a normal distribution. The systematic uncertainty at any
confidence level is given by t n;P b, or simply tb. The interval defined by the systematic uncertainty at
the 95% probability level is written as
ÆB ¼ Æ2b 95%
ð
Þ
ð5:4Þ
which assigns a value of t ¼ 2. This t value assumes large degrees of freedom in an assigned
systematic uncertainty for which t ¼ 1.96, which is rounded to 2 for convenience (2).
The reader has probably experienced systematic errors in measurements. Improperly using the
floating tang at the end of a metal tape measure will offset the measurement, a systematic error. A
more obvious example is reporting the barefoot height of a person based on a measurement taken
while the person was wearing high-heeled shoes. In this case this systematic error, a data-acquisition
error, is the height of the heels. But these errors are obvious!
Consider a home bathroom scale; does it have a systematic error? How might we assign an
uncertainty to its indicated weight? Perhaps we can calibrate the scale using calibrated standard
masses, account for local gravitational acceleration, and correct the output, thereby estimating the
systematic error of the measurement (i.e., direct calibration against a local standard). Or perhaps we
can compare it to a measurement taken in a physician’s office or at the gym and compare each
reading (i.e., a sort of interlaboratory comparison). Or perhaps we can carefully measure the
person’s volume displacement in water and compare the results to estimate differences (i.e.,
concomitant methodology). Or, we can use the specification provided by the manufacturer (i.e.,
experience). Without any of the above, what value would we assign? Would we even suspect a
systematic error?
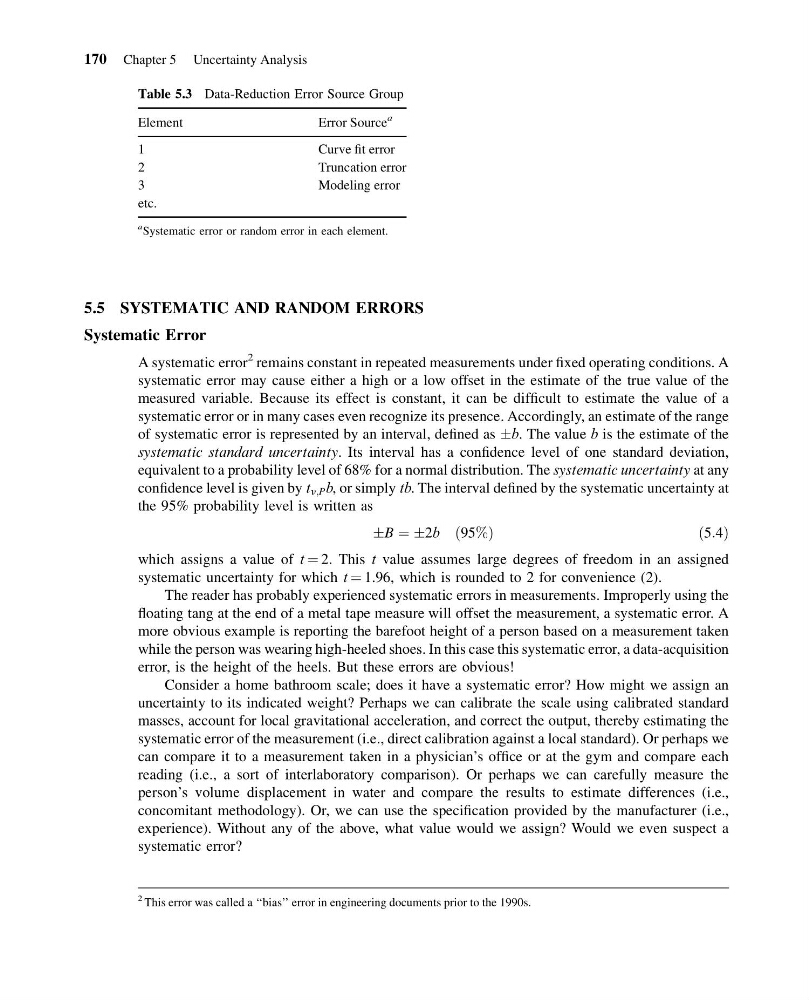
Table 5.3 Data-Reduction Error Source Group
Element
Error Source
a
1
Curve fit error
2
Truncation error
3
Modeling error
etc.
a Systematic error or random error in each element.
2 This error was called a ‘‘bias’’ error in engineering documents prior to the 1990s.
170 Chapter 5 Uncertainty Analysis
14:36:26 Page 170
5.5 SYSTEMATIC AND RANDOM ERRORS
Systematic Error
A systematic error
2 remains constant in repeated measurements under fixed operating conditions. A
systematic error may cause either a high or a low offset in the estimate of the true value of the
measured variable. Because its effect is constant, it can be difficult to estimate the value of a
systematic error or in many cases even recognize its presence. Accordingly, an estimate of the range
of systematic error is represented by an interval, defined as Æb. The value b is the estimate of the
systematic standard uncertainty. Its interval has a confidence level of one standard deviation,
equivalent to a probability level of 68% for a normal distribution. The systematic uncertainty at any
confidence level is given by t n;P b, or simply tb. The interval defined by the systematic uncertainty at
the 95% probability level is written as
ÆB ¼ Æ2b 95%
ð
Þ
ð5:4Þ
which assigns a value of t ¼ 2. This t value assumes large degrees of freedom in an assigned
systematic uncertainty for which t ¼ 1.96, which is rounded to 2 for convenience (2).
The reader has probably experienced systematic errors in measurements. Improperly using the
floating tang at the end of a metal tape measure will offset the measurement, a systematic error. A
more obvious example is reporting the barefoot height of a person based on a measurement taken
while the person was wearing high-heeled shoes. In this case this systematic error, a data-acquisition
error, is the height of the heels. But these errors are obvious!
Consider a home bathroom scale; does it have a systematic error? How might we assign an
uncertainty to its indicated weight? Perhaps we can calibrate the scale using calibrated standard
masses, account for local gravitational acceleration, and correct the output, thereby estimating the
systematic error of the measurement (i.e., direct calibration against a local standard). Or perhaps we
can compare it to a measurement taken in a physician’s office or at the gym and compare each
reading (i.e., a sort of interlaboratory comparison). Or perhaps we can carefully measure the
person’s volume displacement in water and compare the results to estimate differences (i.e.,
concomitant methodology). Or, we can use the specification provided by the manufacturer (i.e.,
experience). Without any of the above, what value would we assign? Would we even suspect a
systematic error?
Table 5.3 Data-Reduction Error Source Group
Element
Error Source
a
1
Curve fit error
2
Truncation error
3
Modeling error
etc.
a Systematic error or random error in each element.
2 This error was called a ‘‘bias’’ error in engineering documents prior to the 1990s.
170 Chapter 5 Uncertainty Analysis