

E1C04 09/14/2010
14:7:50 Page 160
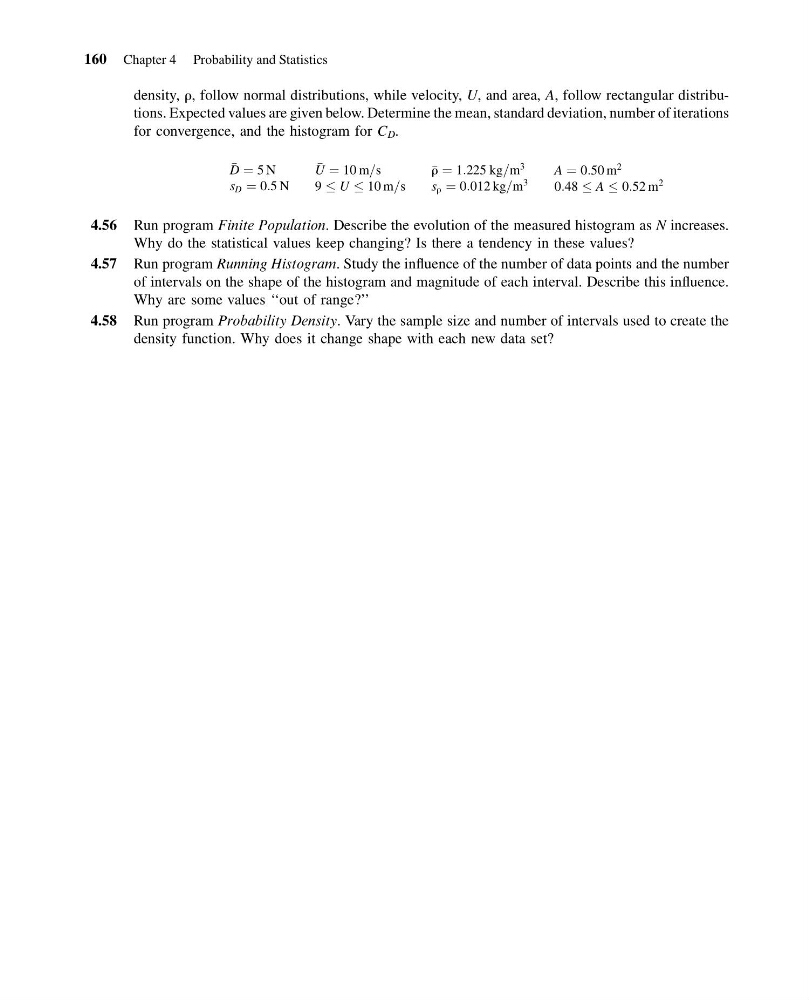
density, r, follow normal distributions, while velocity, U, and area, A, follow rectangular distributions. Expected values are given below. Determine the mean, standard deviation, number of iterations
for convergence, and the histogram for C D .
D ¼ 5 N
s D ¼ 0:5 N
U ¼ 10 m=s
9 U 10 m=s
r ¼ 1:225 kg=m
3
s r ¼ 0:012 kg=m
3
A ¼ 0:50 m
2
0:48 A 0:52 m
2
4.56 Run program Finite Population. Describe the evolution of the measured histogram as N increases.
Why do the statistical values keep changing? Is there a tendency in these values?
4.57 Run program Running Histogram. Study the influence of the number of data points and the number
of intervals on the shape of the histogram and magnitude of each interval. Describe this influence.
Why are some values ‘‘out of range?’’
4.58 Run program Probability Density. Vary the sample size and number of intervals used to create the
density function. Why does it change shape with each new data set?
160 Chapter 4 Probability and Statistics
14:7:50 Page 160
density, r, follow normal distributions, while velocity, U, and area, A, follow rectangular distributions. Expected values are given below. Determine the mean, standard deviation, number of iterations
for convergence, and the histogram for C D .
D ¼ 5 N
s D ¼ 0:5 N
U ¼ 10 m=s
9 U 10 m=s
r ¼ 1:225 kg=m
3
s r ¼ 0:012 kg=m
3
A ¼ 0:50 m
2
0:48 A 0:52 m
2
4.56 Run program Finite Population. Describe the evolution of the measured histogram as N increases.
Why do the statistical values keep changing? Is there a tendency in these values?
4.57 Run program Running Histogram. Study the influence of the number of data points and the number
of intervals on the shape of the histogram and magnitude of each interval. Describe this influence.
Why are some values ‘‘out of range?’’
4.58 Run program Probability Density. Vary the sample size and number of intervals used to create the
density function. Why does it change shape with each new data set?
160 Chapter 4 Probability and Statistics