

E1C04 09/14/2010
14:7:50 Page 159
4.47 An optical velocity measuring instrument provides an updated signal on the passage of small
particles through its focal point. Suppose the average number of particles passing in a given time
interval is 4. Estimate the probability of observing x particle passages in a given time. Use the
Poisson distribution for x ¼ 1 through 10.
4.48 Correlation implies association but does not imply cause and effect. Provide an example in which
variable y may be well associated (correlated) with variable x through some relation but in which
there is little to no cause-and-effect relation between them. Discuss your reasoning.
4.49 A cantilever is loaded at its tip. Tip deflection is measured. The following results are obtained with 10
repetitions of loading (cm):
5.30
5.73
6.77
5.26
4.33
5.45
6.09
5.64
5.81
5.75
Determine the mean value, standard deviation and the best estimate of the true value for this data set.
Over what interval would 50% of the entire population of tip deflection values fall?
4.50 For the data set for cantilever tip deflection in the previous problem, test for outliers using Chauvenet’s
criterion. Recompute as necessary: meanvalue, standard deviation, and the best estimate of the truevalue
for this data set. Over what interval would 50% of the entire population of tip deflection values fall?
4.51 A small sample (N ¼ 7) of the static coefficient of friction (m) between two materials is measured
with the following data set:
0.0043
0.0050
0.0053
0.0047
0.0031
0.0051
0.0049
Test the data for outliers. Determine the mean value and its confidence.
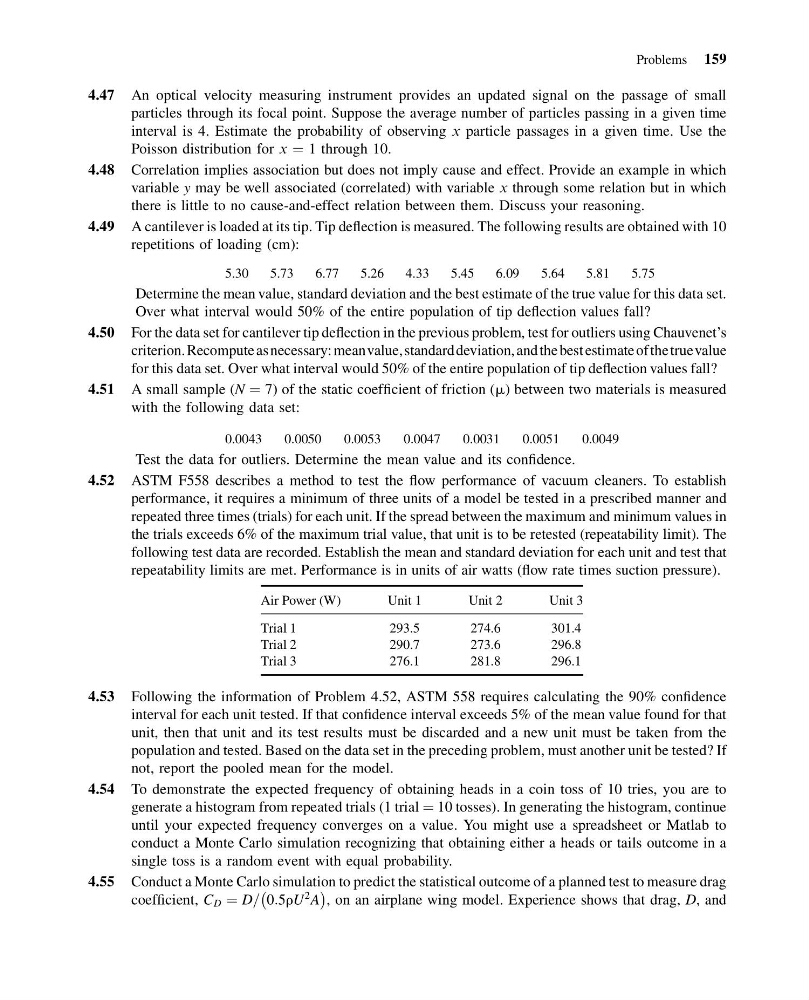
4.52 ASTM F558 describes a method to test the flow performance of vacuum cleaners. To establish
performance, it requires a minimum of three units of a model be tested in a prescribed manner and
repeated three times (trials) for each unit. If the spread between the maximum and minimum values in
the trials exceeds 6% of the maximum trial value, that unit is to be retested (repeatability limit). The
following test data are recorded. Establish the mean and standard deviation for each unit and test that
repeatability limits are met. Performance is in units of air watts (flow rate times suction pressure).
Air Power (W)
Unit 1
Unit 2
Unit 3
Trial 1
293.5
274.6
301.4
Trial 2
290.7
273.6
296.8
Trial 3
276.1
281.8
296.1
4.53 Following the information of Problem 4.52, ASTM 558 requires calculating the 90% confidence
interval for each unit tested. If that confidence interval exceeds 5% of the mean value found for that
unit, then that unit and its test results must be discarded and a new unit must be taken from the
population and tested. Based on the data set in the preceding problem, must another unit be tested? If
not, report the pooled mean for the model.
4.54 To demonstrate the expected frequency of obtaining heads in a coin toss of 10 tries, you are to
generate a histogram from repeated trials (1 trial ¼ 10 tosses). In generating the histogram, continue
until your expected frequency converges on a value. You might use a spreadsheet or Matlab to
conduct a Monte Carlo simulation recognizing that obtaining either a heads or tails outcome in a
single toss is a random event with equal probability.
4.55 Conduct a Monte Carlo simulation to predict the statistical outcome of a planned test to measure drag
coefficient, C D ¼ D= 0:5rU
2
A
À
Á
, on an airplane wing model. Experience shows that drag, D, and
Problems 159
14:7:50 Page 159
4.47 An optical velocity measuring instrument provides an updated signal on the passage of small
particles through its focal point. Suppose the average number of particles passing in a given time
interval is 4. Estimate the probability of observing x particle passages in a given time. Use the
Poisson distribution for x ¼ 1 through 10.
4.48 Correlation implies association but does not imply cause and effect. Provide an example in which
variable y may be well associated (correlated) with variable x through some relation but in which
there is little to no cause-and-effect relation between them. Discuss your reasoning.
4.49 A cantilever is loaded at its tip. Tip deflection is measured. The following results are obtained with 10
repetitions of loading (cm):
5.30
5.73
6.77
5.26
4.33
5.45
6.09
5.64
5.81
5.75
Determine the mean value, standard deviation and the best estimate of the true value for this data set.
Over what interval would 50% of the entire population of tip deflection values fall?
4.50 For the data set for cantilever tip deflection in the previous problem, test for outliers using Chauvenet’s
criterion. Recompute as necessary: meanvalue, standard deviation, and the best estimate of the truevalue
for this data set. Over what interval would 50% of the entire population of tip deflection values fall?
4.51 A small sample (N ¼ 7) of the static coefficient of friction (m) between two materials is measured
with the following data set:
0.0043
0.0050
0.0053
0.0047
0.0031
0.0051
0.0049
Test the data for outliers. Determine the mean value and its confidence.
4.52 ASTM F558 describes a method to test the flow performance of vacuum cleaners. To establish
performance, it requires a minimum of three units of a model be tested in a prescribed manner and
repeated three times (trials) for each unit. If the spread between the maximum and minimum values in
the trials exceeds 6% of the maximum trial value, that unit is to be retested (repeatability limit). The
following test data are recorded. Establish the mean and standard deviation for each unit and test that
repeatability limits are met. Performance is in units of air watts (flow rate times suction pressure).
Air Power (W)
Unit 1
Unit 2
Unit 3
Trial 1
293.5
274.6
301.4
Trial 2
290.7
273.6
296.8
Trial 3
276.1
281.8
296.1
4.53 Following the information of Problem 4.52, ASTM 558 requires calculating the 90% confidence
interval for each unit tested. If that confidence interval exceeds 5% of the mean value found for that
unit, then that unit and its test results must be discarded and a new unit must be taken from the
population and tested. Based on the data set in the preceding problem, must another unit be tested? If
not, report the pooled mean for the model.
4.54 To demonstrate the expected frequency of obtaining heads in a coin toss of 10 tries, you are to
generate a histogram from repeated trials (1 trial ¼ 10 tosses). In generating the histogram, continue
until your expected frequency converges on a value. You might use a spreadsheet or Matlab to
conduct a Monte Carlo simulation recognizing that obtaining either a heads or tails outcome in a
single toss is a random event with equal probability.
4.55 Conduct a Monte Carlo simulation to predict the statistical outcome of a planned test to measure drag
coefficient, C D ¼ D= 0:5rU
2
A
À
Á
, on an airplane wing model. Experience shows that drag, D, and
Problems 159