

E1C04 09/14/2010
14:7:45 Page 152
4.10 SUMMARY
The behavior of a random variable is defined by its unique probability density function, which
provides exact information about its mean value and variability. The purpose of the measurements is
to estimate this density function based on the acquired limited data set. The normal scatter of data
about some central mean value is due to several contributing factors, including the process variable’s
own temporal unsteadiness or spatial distribution under nominally fixed operating conditions, as
well as random errors in the measurement system and in the measurement procedure. Further, a
finite number of measurements of a variable can only go so far in estimating the behavior of an entire
population of values. We discuss how estimates based on a limited data set introduce another
random error into predicting the true value of the measurement, something addressed by the sample
statistics. Statistics is a powerful tool used to interpret and present data. In this chapter, we
developed the most basic methods used to understand and quantify finite-sized data sets. Methods to
estimate the true mean value based on a limited number of data points and the random uncertainty in
such estimates were presented along with treatment of data curve fitting. A summary table of these
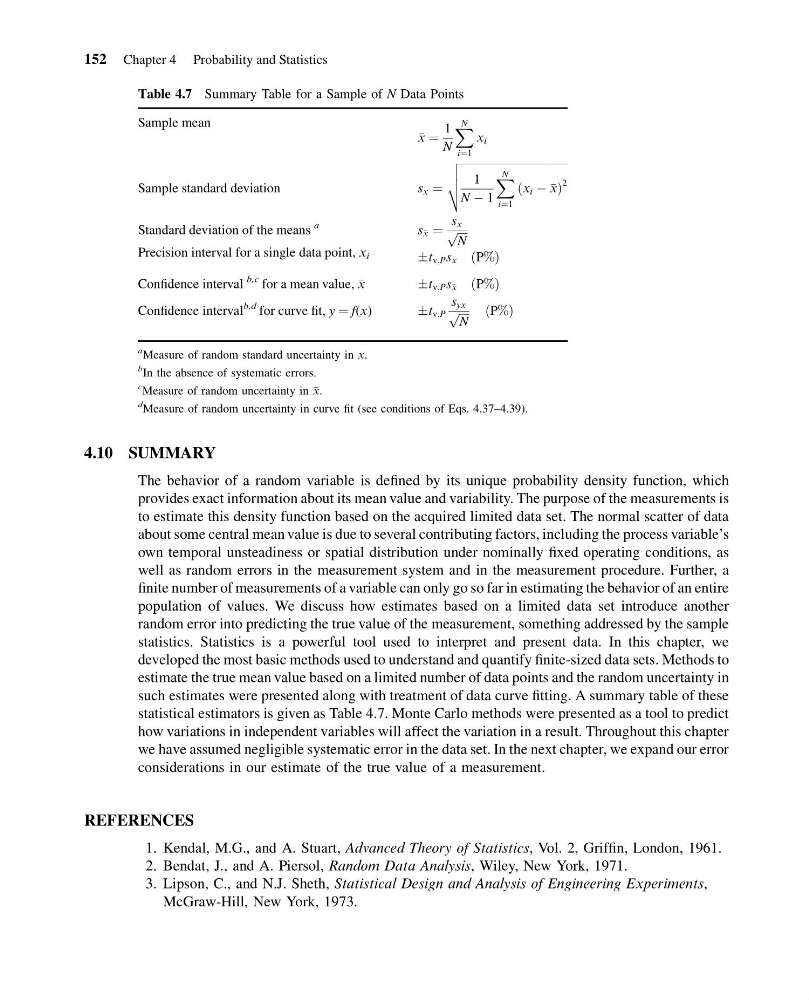
statistical estimators is given as Table 4.7. Monte Carlo methods were presented as a tool to predict
how variations in independent variables will affect the variation in a result. Throughout this chapter
we have assumed negligible systematic error in the data set. In the next chapter, we expand our error
considerations in our estimate of the true value of a measurement.
REFERENCES
1. Kendal, M.G., and A. Stuart, Advanced Theory of Statistics, Vol. 2, Griffin, London, 1961.
2. Bendat, J., and A. Piersol, Random Data Analysis, Wiley, New York, 1971.
3. Lipson, C., and N.J. Sheth, Statistical Design and Analysis of Engineering Experiments,
McGraw-Hill, New York, 1973.
Table 4.7 Summary Table for a Sample of N Data Points
Sample mean
x ¼
1
N
X N
i¼1
x i
Sample standard deviation
s x ¼
ffiffiffiffiffiffiffiffiffiffiffiffiffiffiffiffiffiffiffiffiffiffiffiffiffiffiffiffiffiffiffiffiffiffiffiffiffiffi ffi
1
N À 1
X N
i¼1
x i À
x
ð
Þ
2
v
u
u
t
Standard deviation of the means
a
s
x ¼
s x ffiffiffiffi
N
p
Precision interval for a single data point, x i
Æt v;P s x P%
ð Þ
Confidence interval
b,c for a mean value,
x
Æt v;P s
x
P%
ð Þ
Confidence interval
b,d for curve fit, y ¼ f(x)
Æt v;P
s yx ffiffiffiffi
N
p
P%
ð Þ
a Measure of random standard uncertainty in x.
b In the absence of systematic errors.
c Measure of random uncertainty in
x.
d Measure of random uncertainty in curve fit (see conditions of Eqs. 4.37–4.39).
152 Chapter 4 Probability and Statistics
14:7:45 Page 152
4.10 SUMMARY
The behavior of a random variable is defined by its unique probability density function, which
provides exact information about its mean value and variability. The purpose of the measurements is
to estimate this density function based on the acquired limited data set. The normal scatter of data
about some central mean value is due to several contributing factors, including the process variable’s
own temporal unsteadiness or spatial distribution under nominally fixed operating conditions, as
well as random errors in the measurement system and in the measurement procedure. Further, a
finite number of measurements of a variable can only go so far in estimating the behavior of an entire
population of values. We discuss how estimates based on a limited data set introduce another
random error into predicting the true value of the measurement, something addressed by the sample
statistics. Statistics is a powerful tool used to interpret and present data. In this chapter, we
developed the most basic methods used to understand and quantify finite-sized data sets. Methods to
estimate the true mean value based on a limited number of data points and the random uncertainty in
such estimates were presented along with treatment of data curve fitting. A summary table of these
statistical estimators is given as Table 4.7. Monte Carlo methods were presented as a tool to predict
how variations in independent variables will affect the variation in a result. Throughout this chapter
we have assumed negligible systematic error in the data set. In the next chapter, we expand our error
considerations in our estimate of the true value of a measurement.
REFERENCES
1. Kendal, M.G., and A. Stuart, Advanced Theory of Statistics, Vol. 2, Griffin, London, 1961.
2. Bendat, J., and A. Piersol, Random Data Analysis, Wiley, New York, 1971.
3. Lipson, C., and N.J. Sheth, Statistical Design and Analysis of Engineering Experiments,
McGraw-Hill, New York, 1973.
Table 4.7 Summary Table for a Sample of N Data Points
Sample mean
x ¼
1
N
X N
i¼1
x i
Sample standard deviation
s x ¼
ffiffiffiffiffiffiffiffiffiffiffiffiffiffiffiffiffiffiffiffiffiffiffiffiffiffiffiffiffiffiffiffiffiffiffiffiffiffi ffi
1
N À 1
X N
i¼1
x i À
x
ð
Þ
2
v
u
u
t
Standard deviation of the means
a
s
x ¼
s x ffiffiffiffi
N
p
Precision interval for a single data point, x i
Æt v;P s x P%
ð Þ
Confidence interval
b,c for a mean value,
x
Æt v;P s
x
P%
ð Þ
Confidence interval
b,d for curve fit, y ¼ f(x)
Æt v;P
s yx ffiffiffiffi
N
p
P%
ð Þ
a Measure of random standard uncertainty in x.
b In the absence of systematic errors.
c Measure of random uncertainty in
x.
d Measure of random uncertainty in curve fit (see conditions of Eqs. 4.37–4.39).
152 Chapter 4 Probability and Statistics