

E1C03 09/14/2010
15:24:54 Page 108
Example 3.12
Predict the steady output signal from a second-order instrument having K ¼ 1 unit/unit, z ¼ 2, and
v n ¼ 628 rad/s, which is used to measure the input signal
F t
ð Þ ¼ 5 þ 10 sin 25t þ 20 sin 400t
KNOWN Second-order system
K ¼ 1 unit/unit; z ¼ 2.0; v n ¼ 628 rad/s
F(t) ¼ 5 þ 10 sin 25t þ 20 sin 400t
ASSUMPTIONS Linear system (superposition holds)
FIND y(t)
SOLUTION Since F(t) has a form consisting of a linear addition of multiple input functions,
the steady response signal will have the form of Equation 3.33 of y steady (t) ¼ KF(t) or
y t
ð Þ ¼ 5K þ 10KM 25 rad=s
ð
Þ sin 25t þ F 25 rad=s
ð
Þ
½
þ 20KM 400 rad=s
ð
Þ sin 400t þ F 400 rad=s
ð
Þ
½
Using Equations 3.20 and 3.22, or, alternatively, using Figures 3.16 and 3.17, with v n ¼ 628 rad/s
and z ¼ 2.0, we calculate
M 25 rad=s
ð
Þ¼0:99 F 25 rad=s
ð
Þ¼À 9:1
M 400 rad=s
ð
Þ¼0:39 F 400 rad=s
ð
Þ¼À 77
So that the steady output signal will have the form
y t
ð Þ ¼ 5 þ 9:9 sin 25t À 9:1
ð
Þþ7:8 sin 400t À 77
ð
Þ
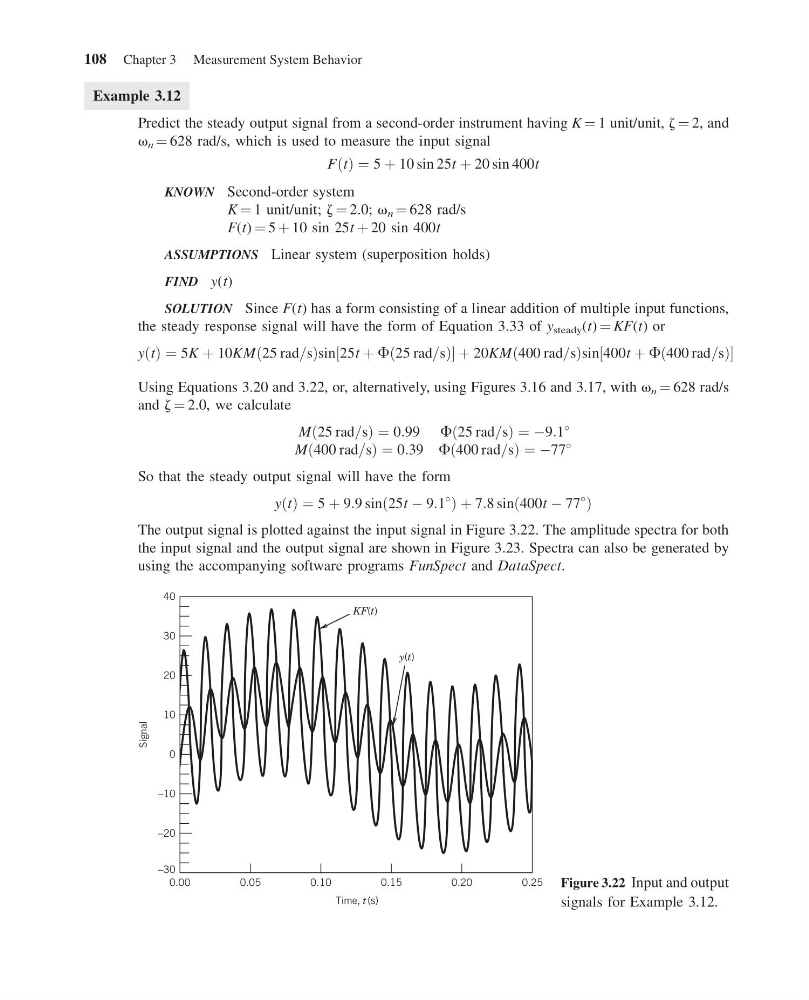
The output signal is plotted against the input signal in Figure 3.22. The amplitude spectra for both
the input signal and the output signal are shown in Figure 3.23. Spectra can also be generated by
using the accompanying software programs FunSpect and DataSpect.
Signal
KF(t)
y(t)
0.00
0.05
0.10
0.15
0.20
0.25
Time, t(s)
40
30
20
10
0
–10
–20
–30
Figure 3.22 Input and output
signals for Example 3.12.
108 Chapter 3 Measurement System Behavior
15:24:54 Page 108
Example 3.12
Predict the steady output signal from a second-order instrument having K ¼ 1 unit/unit, z ¼ 2, and
v n ¼ 628 rad/s, which is used to measure the input signal
F t
ð Þ ¼ 5 þ 10 sin 25t þ 20 sin 400t
KNOWN Second-order system
K ¼ 1 unit/unit; z ¼ 2.0; v n ¼ 628 rad/s
F(t) ¼ 5 þ 10 sin 25t þ 20 sin 400t
ASSUMPTIONS Linear system (superposition holds)
FIND y(t)
SOLUTION Since F(t) has a form consisting of a linear addition of multiple input functions,
the steady response signal will have the form of Equation 3.33 of y steady (t) ¼ KF(t) or
y t
ð Þ ¼ 5K þ 10KM 25 rad=s
ð
Þ sin 25t þ F 25 rad=s
ð
Þ
½
þ 20KM 400 rad=s
ð
Þ sin 400t þ F 400 rad=s
ð
Þ
½
Using Equations 3.20 and 3.22, or, alternatively, using Figures 3.16 and 3.17, with v n ¼ 628 rad/s
and z ¼ 2.0, we calculate
M 25 rad=s
ð
Þ¼0:99 F 25 rad=s
ð
Þ¼À 9:1
M 400 rad=s
ð
Þ¼0:39 F 400 rad=s
ð
Þ¼À 77
So that the steady output signal will have the form
y t
ð Þ ¼ 5 þ 9:9 sin 25t À 9:1
ð
Þþ7:8 sin 400t À 77
ð
Þ
The output signal is plotted against the input signal in Figure 3.22. The amplitude spectra for both
the input signal and the output signal are shown in Figure 3.23. Spectra can also be generated by
using the accompanying software programs FunSpect and DataSpect.
Signal
KF(t)
y(t)
0.00
0.05
0.10
0.15
0.20
0.25
Time, t(s)
40
30
20
10
0
–10
–20
–30
Figure 3.22 Input and output
signals for Example 3.12.
108 Chapter 3 Measurement System Behavior