

3.3 Random Orientation Model of Enzymes
71
i s,elec−enz =
1
2r as
2r as
0
i s,z dz =
i lim
s
2βr as
1 + 1
K
E
ln
k c
k o
max K
E
(1−α) +
1 + 1
K
E
exp[−β(r − r as )]
k c
k o
max K
E
(1−α) +
1 + 1
K
E
exp[−β(r + r as )]
,
(3.19)
and for reduction of S as
i s,elec−enz =
i
lim
s
2βr as
1 + K
E
ln
k c
k o
max K
E
−α +
1 + K
E
exp[−β(r − r as )]
k c
k o
max K
E
−α +
1 + K
E
exp[−β(r + r as )]
. (3.20)
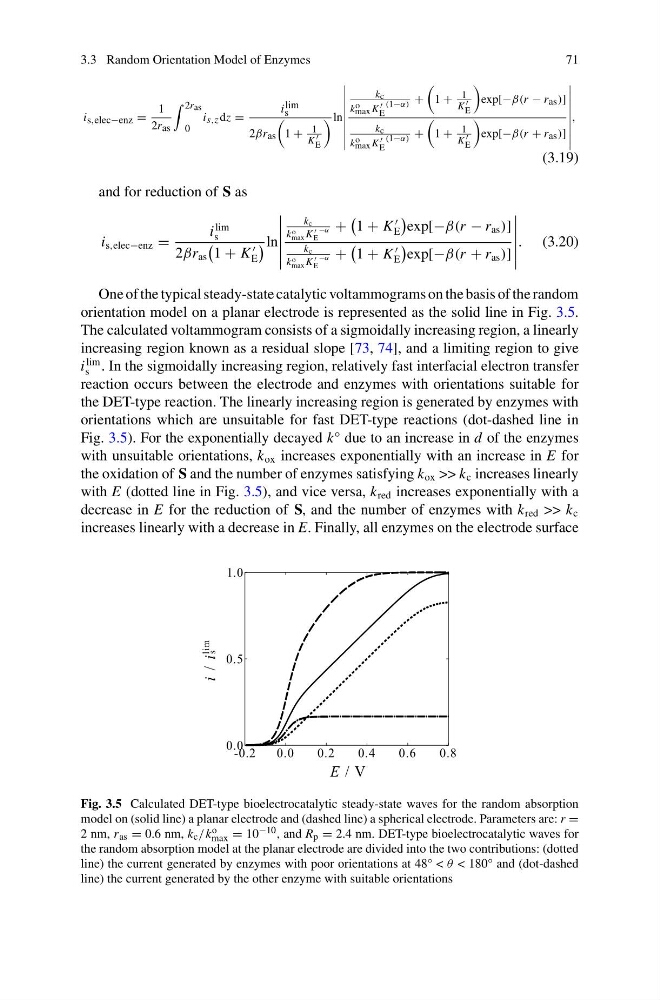
One of the typical steady-state catalytic voltammograms on the basis of the random
orientation model on a planar electrode is represented as the solid line in Fig. 3.5.
The calculated voltammogram consists of a sigmoidally increasing region, a linearly
increasing region known as a residual slope [73, 74], and a limiting region to give
i
lim
s . In the sigmoidally increasing region, relatively fast interfacial electron transfer
reaction occurs between the electrode and enzymes with orientations suitable for
the DET-type reaction. The linearly increasing region is generated by enzymes with
orientations which are unsuitable for fast DET-type reactions (dot-dashed line in
Fig. 3.5). For the exponentially decayed k° due to an increase in d of the enzymes
with unsuitable orientations, k ox increases exponentially with an increase in E for
the oxidation of S and the number of enzymes satisfying k ox >> k c increases linearly
with E (dotted line in Fig. 3.5), and vice versa, k red increases exponentially with a
decrease in E for the reduction of S, and the number of enzymes with k red >> k c
increases linearly with a decrease in E. Finally, all enzymes on the electrode surface
-0.2
0.0
0.2
0.4
0.6
0.8
0.0
0.5
1.0
E / V
i / is
lim
Fig. 3.5 Calculated DET-type bioelectrocatalytic steady-state waves for the random absorption
model on (solid line) a planar electrode and (dashed line) a spherical electrode. Parameters are: r =
2 nm, r as = 0.6 nm, k c /k o
max = 10 −10 , and R p = 2.4 nm. DET-type bioelectrocatalytic waves for
the random absorption model at the planar electrode are divided into the two contributions: (dotted
line) the current generated by enzymes with poor orientations at 48° < θ < 180° and (dot-dashed
line) the current generated by the other enzyme with suitable orientations
71
i s,elec−enz =
1
2r as
2r as
0
i s,z dz =
i lim
s
2βr as
1 + 1
K
E
ln
k c
k o
max K
E
(1−α) +
1 + 1
K
E
exp[−β(r − r as )]
k c
k o
max K
E
(1−α) +
1 + 1
K
E
exp[−β(r + r as )]
,
(3.19)
and for reduction of S as
i s,elec−enz =
i
lim
s
2βr as
1 + K
E
ln
k c
k o
max K
E
−α +
1 + K
E
exp[−β(r − r as )]
k c
k o
max K
E
−α +
1 + K
E
exp[−β(r + r as )]
. (3.20)
One of the typical steady-state catalytic voltammograms on the basis of the random
orientation model on a planar electrode is represented as the solid line in Fig. 3.5.
The calculated voltammogram consists of a sigmoidally increasing region, a linearly
increasing region known as a residual slope [73, 74], and a limiting region to give
i
lim
s . In the sigmoidally increasing region, relatively fast interfacial electron transfer
reaction occurs between the electrode and enzymes with orientations suitable for
the DET-type reaction. The linearly increasing region is generated by enzymes with
orientations which are unsuitable for fast DET-type reactions (dot-dashed line in
Fig. 3.5). For the exponentially decayed k° due to an increase in d of the enzymes
with unsuitable orientations, k ox increases exponentially with an increase in E for
the oxidation of S and the number of enzymes satisfying k ox >> k c increases linearly
with E (dotted line in Fig. 3.5), and vice versa, k red increases exponentially with a
decrease in E for the reduction of S, and the number of enzymes with k red >> k c
increases linearly with a decrease in E. Finally, all enzymes on the electrode surface
-0.2
0.0
0.2
0.4
0.6
0.8
0.0
0.5
1.0
E / V
i / is
lim
Fig. 3.5 Calculated DET-type bioelectrocatalytic steady-state waves for the random absorption
model on (solid line) a planar electrode and (dashed line) a spherical electrode. Parameters are: r =
2 nm, r as = 0.6 nm, k c /k o
max = 10 −10 , and R p = 2.4 nm. DET-type bioelectrocatalytic waves for
the random absorption model at the planar electrode are divided into the two contributions: (dotted
line) the current generated by enzymes with poor orientations at 48° < θ < 180° and (dot-dashed
line) the current generated by the other enzyme with suitable orientations