

2.1 Reaction-Layer Approximation in a Homogeneous System
25
Figure 2.1 shows concentration profiles of M ox and the reduced mediator (M red ) in
steady-state MET-type bioelectrocatalysis in a homogeneous solution with a k M value
independent of c M ox (x,t) . The area of the exponentially decaying curve of c M red (x,t) is
identical with that of the rectangle-shape with hatched lines, when k M is independent
of c M ox (x,t) . This means that i s corresponds to the steady-state rate of the regeneration
of M red at an electrode.
When M undergoes reversible response at an electrode, c M ox (0) is given by
c M ox (0) =
K M
1 + K M
c
0
M
=
c
0
M
2
tanh
n M F
2RT
E − E
◦◦
M
+ 1
,
(2.7)
with
K M =
c M ox
c M red
x=0
=
c M ox
c
0
M − c M ox
x=0
= exp
n M F
RT
E − E
◦◦
M
,
(2.8)
where c
0
M
≡ c M red + c M ox
and E
◦◦
M denote the total concentration and the formal
potential of M, respectively. Since c M ox sigmoidally changes with the electrode
potential (E), as given by Eq. (2.7), steady-state voltammograms under these situations provide a sigmoidal shape with its half-wave potential identical to E
◦◦
M .
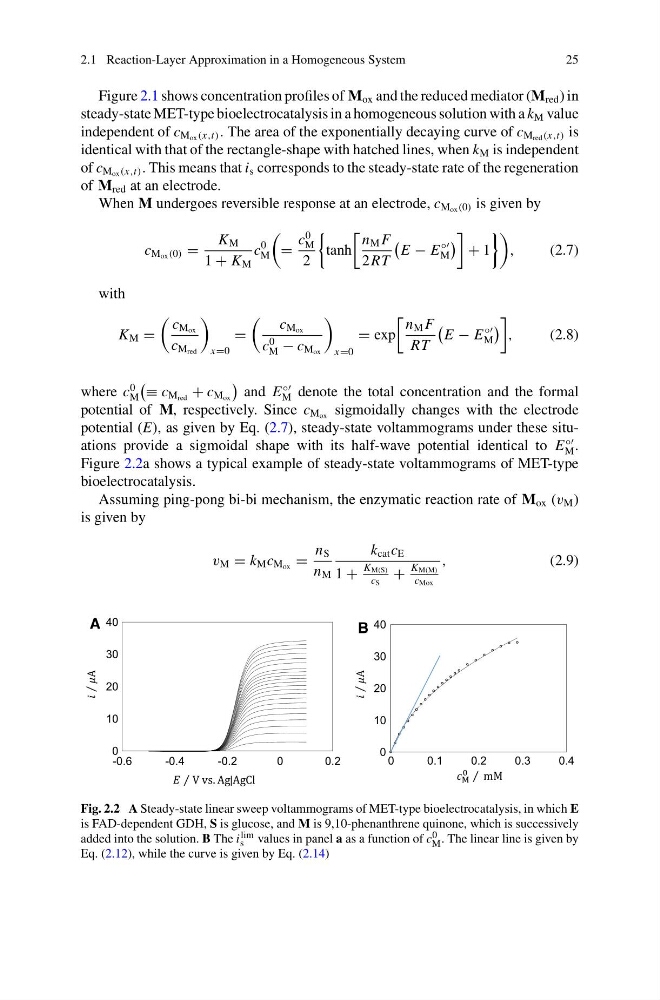
Figure 2.2a shows a typical example of steady-state voltammograms of MET-type
bioelectrocatalysis.
Assuming ping-pong bi-bi mechanism, the enzymatic reaction rate of M ox (v M )
is given by
v M = k M c M ox =
n S
n M
k cat c E
1 +
K M(S)
c S
+
K M(M)
c Mox
,
(2.9)
B
A
⁄
0
10
20
30
40
-0.6
-0.4
-0.2
0
0.2
0
10
20
30
40
0
0.1
0.2
0.3
0.4
⁄
Fig. 2.2 A Steady-state linear sweep voltammograms of MET-type bioelectrocatalysis, in which E
is FAD-dependent GDH, S is glucose, and M is 9,10-phenanthrene quinone, which is successively
added into the solution. B The i lim
s values in panel a as a function of c 0
M . The linear line is given by
Eq. (2.12), while the curve is given by Eq. (2.14)
25
Figure 2.1 shows concentration profiles of M ox and the reduced mediator (M red ) in
steady-state MET-type bioelectrocatalysis in a homogeneous solution with a k M value
independent of c M ox (x,t) . The area of the exponentially decaying curve of c M red (x,t) is
identical with that of the rectangle-shape with hatched lines, when k M is independent
of c M ox (x,t) . This means that i s corresponds to the steady-state rate of the regeneration
of M red at an electrode.
When M undergoes reversible response at an electrode, c M ox (0) is given by
c M ox (0) =
K M
1 + K M
c
0
M
=
c
0
M
2
tanh
n M F
2RT
E − E
◦◦
M
+ 1
,
(2.7)
with
K M =
c M ox
c M red
x=0
=
c M ox
c
0
M − c M ox
x=0
= exp
n M F
RT
E − E
◦◦
M
,
(2.8)
where c
0
M
≡ c M red + c M ox
and E
◦◦
M denote the total concentration and the formal
potential of M, respectively. Since c M ox sigmoidally changes with the electrode
potential (E), as given by Eq. (2.7), steady-state voltammograms under these situations provide a sigmoidal shape with its half-wave potential identical to E
◦◦
M .
Figure 2.2a shows a typical example of steady-state voltammograms of MET-type
bioelectrocatalysis.
Assuming ping-pong bi-bi mechanism, the enzymatic reaction rate of M ox (v M )
is given by
v M = k M c M ox =
n S
n M
k cat c E
1 +
K M(S)
c S
+
K M(M)
c Mox
,
(2.9)
B
A
⁄
0
10
20
30
40
-0.6
-0.4
-0.2
0
0.2
0
10
20
30
40
0
0.1
0.2
0.3
0.4
⁄
Fig. 2.2 A Steady-state linear sweep voltammograms of MET-type bioelectrocatalysis, in which E
is FAD-dependent GDH, S is glucose, and M is 9,10-phenanthrene quinone, which is successively
added into the solution. B The i lim
s values in panel a as a function of c 0
M . The linear line is given by
Eq. (2.12), while the curve is given by Eq. (2.14)