

10.4 Fermi–Dirac Statistics
547
ε F
0
(b)
ε
Ω
Ω
ε F
0
(a)
ε
Ω
Ω
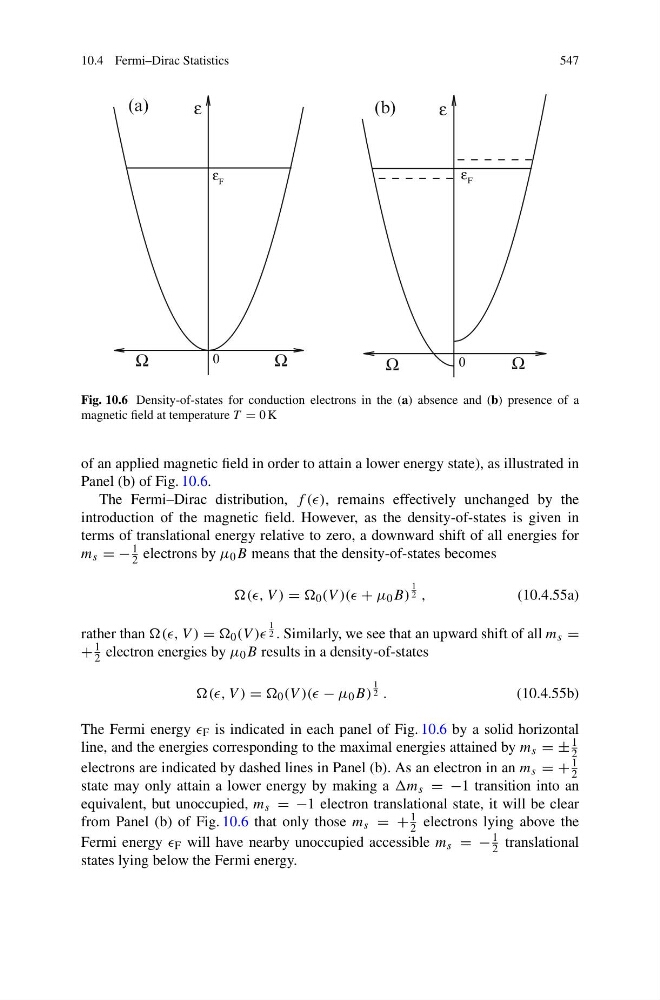
Fig. 10.6 Density-of-states for conduction electrons in the (a) absence and (b) presence of a
magnetic field at temperature T = 0 K
of an applied magnetic field in order to attain a lower energy state), as illustrated in
Panel (b) of Fig. 10.6.
The Fermi–Dirac distribution, f ((), remains effectively unchanged by the
introduction of the magnetic field. However, as the density-of-states is given in
terms of translational energy relative to zero, a downward shift of all energies for
m s = −
1
2 electrons by μ 0 B means that the density-of-states becomes
((, V ) = 0 (V )(( + μ 0 B)
1
2 ,
(10.4.55a)
rather than (, V ) = 0 (V ))
1
2 . Similarly, we see that an upward shift of all m s =
+
1
2 electron energies by μ 0 B results in a density-of-states
((, V ) = 0 (V )(( − μ 0 B)
1
2 .
(10.4.55b)
The Fermi energy F is indicated in each panel of Fig. 10.6 by a solid horizontal
line, and the energies corresponding to the maximal energies attained by m s = ±
1
2
electrons are indicated by dashed lines in Panel (b). As an electron in an m s = +
1
2
state may only attain a lower energy by making a m s = −1 transition into an
equivalent, but unoccupied, m s = −1 electron translational state, it will be clear
from Panel (b) of Fig. 10.6 that only those m s = +
1
2 electrons lying above the
Fermi energy F will have nearby unoccupied accessible m s = −
1
2 translational
states lying below the Fermi energy.
547
ε F
0
(b)
ε
Ω
Ω
ε F
0
(a)
ε
Ω
Ω
Fig. 10.6 Density-of-states for conduction electrons in the (a) absence and (b) presence of a
magnetic field at temperature T = 0 K
of an applied magnetic field in order to attain a lower energy state), as illustrated in
Panel (b) of Fig. 10.6.
The Fermi–Dirac distribution, f ((), remains effectively unchanged by the
introduction of the magnetic field. However, as the density-of-states is given in
terms of translational energy relative to zero, a downward shift of all energies for
m s = −
1
2 electrons by μ 0 B means that the density-of-states becomes
((, V ) = 0 (V )(( + μ 0 B)
1
2 ,
(10.4.55a)
rather than (, V ) = 0 (V ))
1
2 . Similarly, we see that an upward shift of all m s =
+
1
2 electron energies by μ 0 B results in a density-of-states
((, V ) = 0 (V )(( − μ 0 B)
1
2 .
(10.4.55b)
The Fermi energy F is indicated in each panel of Fig. 10.6 by a solid horizontal
line, and the energies corresponding to the maximal energies attained by m s = ±
1
2
electrons are indicated by dashed lines in Panel (b). As an electron in an m s = +
1
2
state may only attain a lower energy by making a m s = −1 transition into an
equivalent, but unoccupied, m s = −1 electron translational state, it will be clear
from Panel (b) of Fig. 10.6 that only those m s = +
1
2 electrons lying above the
Fermi energy F will have nearby unoccupied accessible m s = −
1
2 translational
states lying below the Fermi energy.