

112
2 Macroscopic Thermodynamics
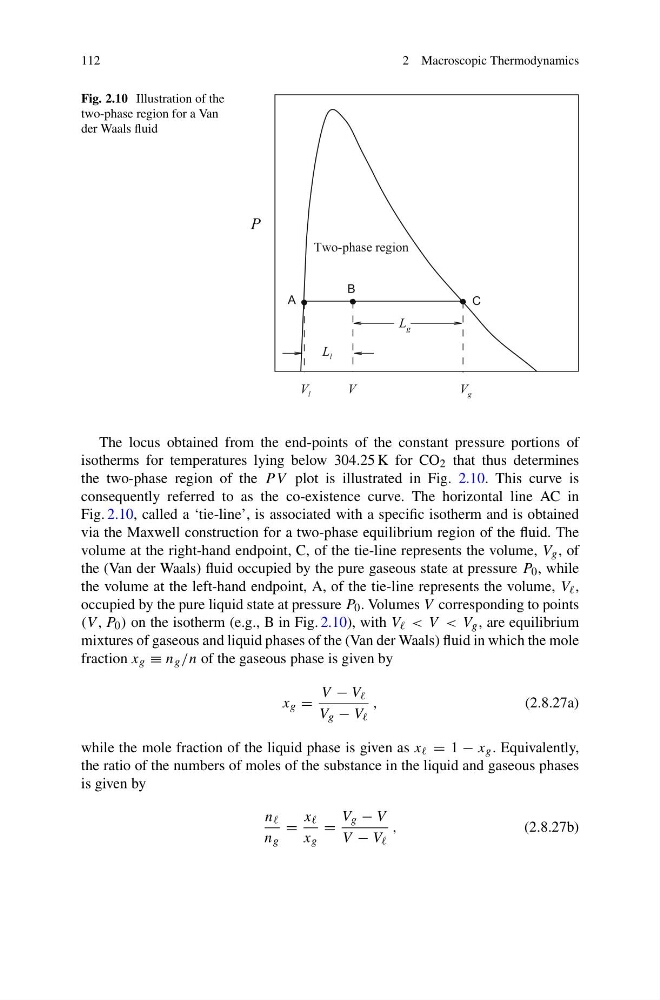
Fig. 2.10 Illustration of the
two-phase region for a Van
der Waals fluid
V
V g
V l
P
A
B
C
L g
L l
Two-phase region
The locus obtained from the end-points of the constant pressure portions of
isotherms for temperatures lying below 304.25 K for CO 2 that thus determines
the two-phase region of the P V plot is illustrated in Fig. 2.10. This curve is
consequently referred to as the co-existence curve. The horizontal line AC in
Fig. 2.10, called a ‘tie-line’, is associated with a specific isotherm and is obtained
via the Maxwell construction for a two-phase equilibrium region of the fluid. The
volume at the right-hand endpoint, C, of the tie-line represents the volume, V g , of
the (Van der Waals) fluid occupied by the pure gaseous state at pressure P 0 , while
the volume at the left-hand endpoint, A, of the tie-line represents the volume, V ,
occupied by the pure liquid state at pressure P 0 . Volumes V corresponding to points
(V , P 0 ) on the isotherm (e.g., B in Fig. 2.10), with V < V < V g , are equilibrium
mixtures of gaseous and liquid phases of the (Van der Waals) fluid in which the mole
fraction x g ≡ n g /n of the gaseous phase is given by
x g =
V − V
V g − V
,
(2.8.27a)
while the mole fraction of the liquid phase is given as x = 1 − x g . Equivalently,
the ratio of the numbers of moles of the substance in the liquid and gaseous phases
is given by
n
n g
=
x
x g
=
V g − V
V − V
,
(2.8.27b)
2 Macroscopic Thermodynamics
Fig. 2.10 Illustration of the
two-phase region for a Van
der Waals fluid
V
V g
V l
P
A
B
C
L g
L l
Two-phase region
The locus obtained from the end-points of the constant pressure portions of
isotherms for temperatures lying below 304.25 K for CO 2 that thus determines
the two-phase region of the P V plot is illustrated in Fig. 2.10. This curve is
consequently referred to as the co-existence curve. The horizontal line AC in
Fig. 2.10, called a ‘tie-line’, is associated with a specific isotherm and is obtained
via the Maxwell construction for a two-phase equilibrium region of the fluid. The
volume at the right-hand endpoint, C, of the tie-line represents the volume, V g , of
the (Van der Waals) fluid occupied by the pure gaseous state at pressure P 0 , while
the volume at the left-hand endpoint, A, of the tie-line represents the volume, V ,
occupied by the pure liquid state at pressure P 0 . Volumes V corresponding to points
(V , P 0 ) on the isotherm (e.g., B in Fig. 2.10), with V < V < V g , are equilibrium
mixtures of gaseous and liquid phases of the (Van der Waals) fluid in which the mole
fraction x g ≡ n g /n of the gaseous phase is given by
x g =
V − V
V g − V
,
(2.8.27a)
while the mole fraction of the liquid phase is given as x = 1 − x g . Equivalently,
the ratio of the numbers of moles of the substance in the liquid and gaseous phases
is given by
n
n g
=
x
x g
=
V g − V
V − V
,
(2.8.27b)