

[2, 217]. Only below the glass transition temperature does astronomical viscosity and loss of rotational freedom begin to slow ice
nucleation [2, 217, 218]. The fact that nucleation rates sometimes
rise in the vicinity of and even below T G in easily vitrifiable solutions
has led to the suggestion that glass formation may catalyze ice
nucleation by preventing clusters of water molecules from diffusing
apart, thus facilitating their mutual bonding [219]. However, a
simpler and presently better supported explanation is that strongly
vitrifiable solutions merely depress heterogeneous nucleation to
near T G , and further cooling then suppresses it due to additional
viscosity elevation, coincidentally resulting in nucleation peaks near
T G .
2.4 Kinetic Aspects
of Ice Formation
in Vitrification
Solutions During
Cooling
Boutron was the first to characterize the quantitative relationships
between the cooling rate of CPA-water solutions of different concentrations and their ability to escape from ice formation on cooling, as evidenced by the lack of exotherms recorded using
differential scanning calorimetry [123]. His modeling eventually
led [42] to an equation that accurately predicts the amount of ice
formed during the cooling of cryoprotectant solutions at different
rates given certain starting information, such as the amount of ice
that forms at very low cooling rates, in which ice formation is
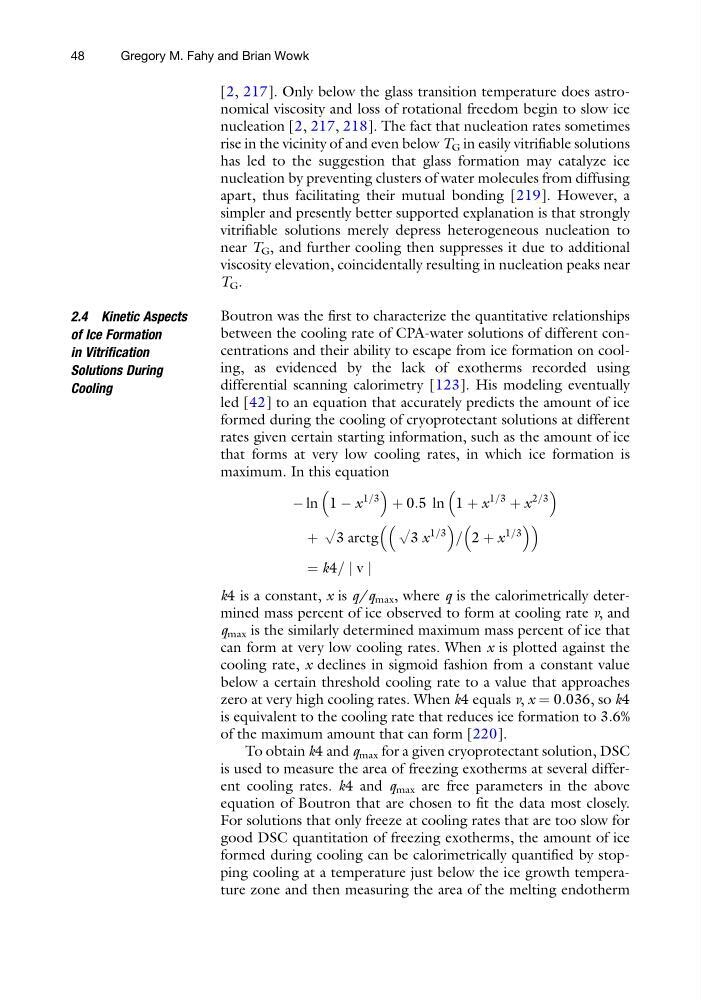
maximum. In this equation
À ln 1 À x
1=3
þ 0:5 ln 1 þ x
1=3
þ x
2=3
þ √3 arctg √3 x
1=3
= 2 þ x
1=3
¼ k4= j v j
k4 is a constant, x is q/q max , where q is the calorimetrically determined mass percent of ice observed to form at cooling rate v, and
q max is the similarly determined maximum mass percent of ice that
can form at very low cooling rates. When x is plotted against the
cooling rate, x declines in sigmoid fashion from a constant value
below a certain threshold cooling rate to a value that approaches
zero at very high cooling rates. When k4 equals v, x ¼ 0.036, so k4
is equivalent to the cooling rate that reduces ice formation to 3.6%
of the maximum amount that can form [220].
To obtain k4 and q max for a given cryoprotectant solution, DSC
is used to measure the area of freezing exotherms at several different cooling rates. k4 and q max are free parameters in the above
equation of Boutron that are chosen to fit the data most closely.
For solutions that only freeze at cooling rates that are too slow for
good DSC quantitation of freezing exotherms, the amount of ice
formed during cooling can be calorimetrically quantified by stopping cooling at a temperature just below the ice growth temperature zone and then measuring the area of the melting endotherm
48
Gregory M. Fahy and Brian Wowk
nucleation [2, 217, 218]. The fact that nucleation rates sometimes
rise in the vicinity of and even below T G in easily vitrifiable solutions
has led to the suggestion that glass formation may catalyze ice
nucleation by preventing clusters of water molecules from diffusing
apart, thus facilitating their mutual bonding [219]. However, a
simpler and presently better supported explanation is that strongly
vitrifiable solutions merely depress heterogeneous nucleation to
near T G , and further cooling then suppresses it due to additional
viscosity elevation, coincidentally resulting in nucleation peaks near
T G .
2.4 Kinetic Aspects
of Ice Formation
in Vitrification
Solutions During
Cooling
Boutron was the first to characterize the quantitative relationships
between the cooling rate of CPA-water solutions of different concentrations and their ability to escape from ice formation on cooling, as evidenced by the lack of exotherms recorded using
differential scanning calorimetry [123]. His modeling eventually
led [42] to an equation that accurately predicts the amount of ice
formed during the cooling of cryoprotectant solutions at different
rates given certain starting information, such as the amount of ice
that forms at very low cooling rates, in which ice formation is
maximum. In this equation
À ln 1 À x
1=3
þ 0:5 ln 1 þ x
1=3
þ x
2=3
þ √3 arctg √3 x
1=3
= 2 þ x
1=3
¼ k4= j v j
k4 is a constant, x is q/q max , where q is the calorimetrically determined mass percent of ice observed to form at cooling rate v, and
q max is the similarly determined maximum mass percent of ice that
can form at very low cooling rates. When x is plotted against the
cooling rate, x declines in sigmoid fashion from a constant value
below a certain threshold cooling rate to a value that approaches
zero at very high cooling rates. When k4 equals v, x ¼ 0.036, so k4
is equivalent to the cooling rate that reduces ice formation to 3.6%
of the maximum amount that can form [220].
To obtain k4 and q max for a given cryoprotectant solution, DSC
is used to measure the area of freezing exotherms at several different cooling rates. k4 and q max are free parameters in the above
equation of Boutron that are chosen to fit the data most closely.
For solutions that only freeze at cooling rates that are too slow for
good DSC quantitation of freezing exotherms, the amount of ice
formed during cooling can be calorimetrically quantified by stopping cooling at a temperature just below the ice growth temperature zone and then measuring the area of the melting endotherm
48
Gregory M. Fahy and Brian Wowk