

(d) Determine the intensity of the peak at 1650 cm
À1
(IνH 2 O), using a baseline from 1700 to 1600 cm
À1
, and
save the result.
(e) Determine IνH 2 O/IνCO from steps (b) and (d) and save
the result.
(f) Steps (a) through (e) need to be applied to all the spectra
that have been recorded during the run.
2. In a spreadsheet program, enter column listing: (1) spectrum
number, (2) time point of collection, and (3) peak intensity of
water scissoring band (IνH 2 O) and lipid ester band (νCO), as
well as their ratio (IνH 2 O/IνCO). Create a plot in which the
IνH 2 O/IνCO is plotted as a function of the drying time.
3.10 Spectral
Analysis: Glass
Transition
Temperature
of Amorphous
Systems
This procedure is particularly suitable to study dry sugar glasses but
can also be adapted for other systems/conditions. Sugar glass
transitions can be studied by following the band position of the
OH stretching vibration band around 3300 cm
À1 , arising from
sugar OH groups, as a function of the temperature:
1. Use the following procedure to calculate the position of the
OH stretching band of each spectrum (each labeled with its
own #):
(a) Open spectrum, and select the spectral region between
3600 and 3000 cm
À1 .
(b) Normalize this region, such that the peak around
3300 cm
À1 is normalized to 1.
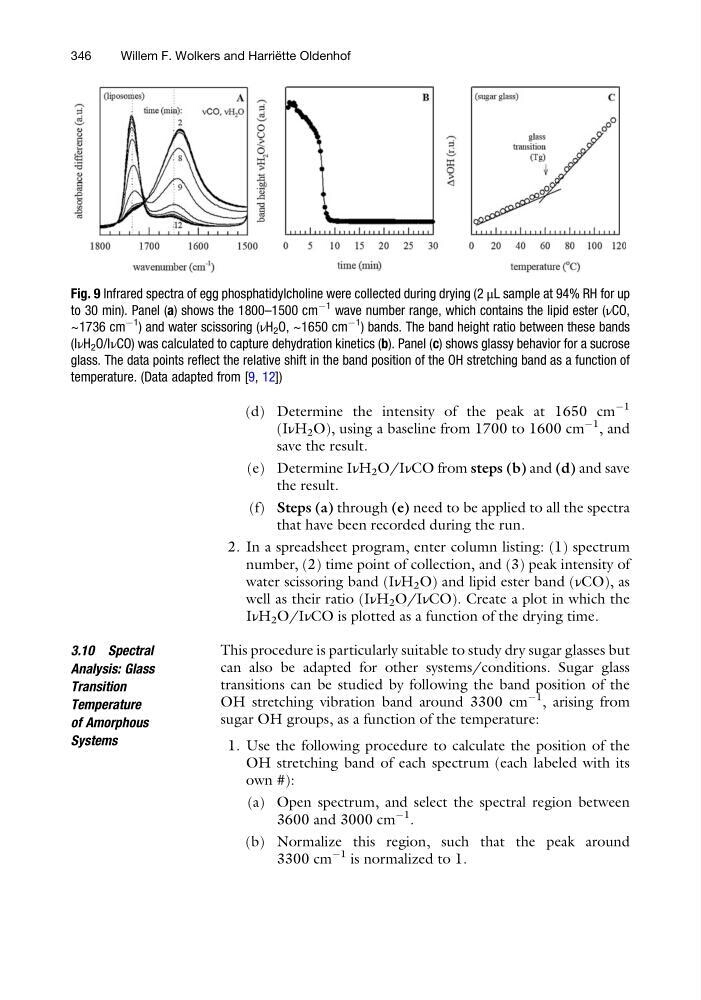
Fig. 9 Infrared spectra of egg phosphatidylcholine were collected during drying (2 μL sample at 94% RH for up
to 30 min). Panel (a) shows the 1800–1500 cm
À1 wave number range, which contains the lipid ester (νCO,
~1736 cm
À1
) and water scissoring (νH 2 O, ~1650 cm
À1 ) bands. The band height ratio between these bands
(IνH 2 O/IνCO) was calculated to capture dehydration kinetics (b). Panel (c) shows glassy behavior for a sucrose
glass. The data points reflect the relative shift in the band position of the OH stretching band as a function of
temperature. (Data adapted from [9, 12])
346
Willem F. Wolkers and Harrie ¨ tte Oldenhof
À1
(IνH 2 O), using a baseline from 1700 to 1600 cm
À1
, and
save the result.
(e) Determine IνH 2 O/IνCO from steps (b) and (d) and save
the result.
(f) Steps (a) through (e) need to be applied to all the spectra
that have been recorded during the run.
2. In a spreadsheet program, enter column listing: (1) spectrum
number, (2) time point of collection, and (3) peak intensity of
water scissoring band (IνH 2 O) and lipid ester band (νCO), as
well as their ratio (IνH 2 O/IνCO). Create a plot in which the
IνH 2 O/IνCO is plotted as a function of the drying time.
3.10 Spectral
Analysis: Glass
Transition
Temperature
of Amorphous
Systems
This procedure is particularly suitable to study dry sugar glasses but
can also be adapted for other systems/conditions. Sugar glass
transitions can be studied by following the band position of the
OH stretching vibration band around 3300 cm
À1 , arising from
sugar OH groups, as a function of the temperature:
1. Use the following procedure to calculate the position of the
OH stretching band of each spectrum (each labeled with its
own #):
(a) Open spectrum, and select the spectral region between
3600 and 3000 cm
À1 .
(b) Normalize this region, such that the peak around
3300 cm
À1 is normalized to 1.
Fig. 9 Infrared spectra of egg phosphatidylcholine were collected during drying (2 μL sample at 94% RH for up
to 30 min). Panel (a) shows the 1800–1500 cm
À1 wave number range, which contains the lipid ester (νCO,
~1736 cm
À1
) and water scissoring (νH 2 O, ~1650 cm
À1 ) bands. The band height ratio between these bands
(IνH 2 O/IνCO) was calculated to capture dehydration kinetics (b). Panel (c) shows glassy behavior for a sucrose
glass. The data points reflect the relative shift in the band position of the OH stretching band as a function of
temperature. (Data adapted from [9, 12])
346
Willem F. Wolkers and Harrie ¨ tte Oldenhof