

2. In a spreadsheet program, enter column listing: (1) spectrum
number, (2) sample temperature during acquisition, and
(3) calculated area of the 1640–1605 cm
À1 spectral range in
the inverted second derivative difference spectrum. Create a
plot in which the area is plotted as a function of the temperature at which the spectra were recorded.
3.9 Spectral
Analysis: Drying
Kinetics
This procedure is especially suitable for use with liposome model
systems but can also be adapted for cells. When lipids are studied, in
addition to monitoring dehydration-induced changes in the position of the symmetric CH 2 stretching band (νCH 2 , ~2850 cm
À1 ),
the line-height ratio between the water scissoring band (νH 2 O,
~1650 cm
À1 ) and the lipid ester band (νCO, ~1736 cm
À1
) can be
used as a measure for the water content of the sample during drying
(see Fig. 9):
1. Use the following procedure/macro to calculate the lineheight ratio between the water scissoring band and the lipid
ester band (IνH 2 O/IνCO) of each spectrum (each labeled with
its own #):
(a) Open spectrum, and select the spectral region from 1750
to 1700 cm
À1 .
(b) Determine the intensity of the peak at 1736 cm
À1 (IνCO),
using a baseline from 1750 to 1700 cm
À1 , and save the
result.
(c) Select the spectral region from 1700 to 1600 cm
À1 .
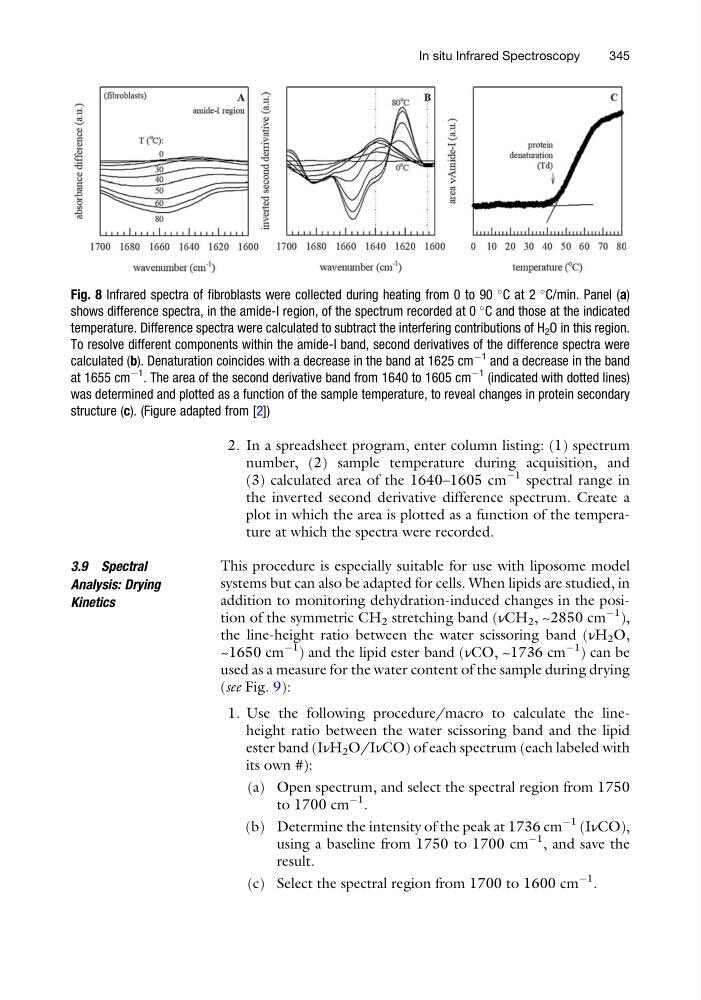
Fig. 8 Infrared spectra of fibroblasts were collected during heating from 0 to 90
C at 2
C/min. Panel (a)
shows difference spectra, in the amide-I region, of the spectrum recorded at 0
C and those at the indicated
temperature. Difference spectra were calculated to subtract the interfering contributions of H 2 O in this region.
To resolve different components within the amide-I band, second derivatives of the difference spectra were
calculated (b). Denaturation coincides with a decrease in the band at 1625 cm
À1 and a decrease in the band
at 1655 cm
À1
. The area of the second derivative band from 1640 to 1605 cm
À1 (indicated with dotted lines)
was determined and plotted as a function of the sample temperature, to reveal changes in protein secondary
structure (c). (Figure adapted from [2])
In situ Infrared Spectroscopy
345
number, (2) sample temperature during acquisition, and
(3) calculated area of the 1640–1605 cm
À1 spectral range in
the inverted second derivative difference spectrum. Create a
plot in which the area is plotted as a function of the temperature at which the spectra were recorded.
3.9 Spectral
Analysis: Drying
Kinetics
This procedure is especially suitable for use with liposome model
systems but can also be adapted for cells. When lipids are studied, in
addition to monitoring dehydration-induced changes in the position of the symmetric CH 2 stretching band (νCH 2 , ~2850 cm
À1 ),
the line-height ratio between the water scissoring band (νH 2 O,
~1650 cm
À1 ) and the lipid ester band (νCO, ~1736 cm
À1
) can be
used as a measure for the water content of the sample during drying
(see Fig. 9):
1. Use the following procedure/macro to calculate the lineheight ratio between the water scissoring band and the lipid
ester band (IνH 2 O/IνCO) of each spectrum (each labeled with
its own #):
(a) Open spectrum, and select the spectral region from 1750
to 1700 cm
À1 .
(b) Determine the intensity of the peak at 1736 cm
À1 (IνCO),
using a baseline from 1750 to 1700 cm
À1 , and save the
result.
(c) Select the spectral region from 1700 to 1600 cm
À1 .
Fig. 8 Infrared spectra of fibroblasts were collected during heating from 0 to 90
C at 2
C/min. Panel (a)
shows difference spectra, in the amide-I region, of the spectrum recorded at 0
C and those at the indicated
temperature. Difference spectra were calculated to subtract the interfering contributions of H 2 O in this region.
To resolve different components within the amide-I band, second derivatives of the difference spectra were
calculated (b). Denaturation coincides with a decrease in the band at 1625 cm
À1 and a decrease in the band
at 1655 cm
À1
. The area of the second derivative band from 1640 to 1605 cm
À1 (indicated with dotted lines)
was determined and plotted as a function of the sample temperature, to reveal changes in protein secondary
structure (c). (Figure adapted from [2])
In situ Infrared Spectroscopy
345