

(a) Open spectrum and calculate the second derivative spectrum, using a 13-point smoothing factor.
(b) Select the spectral region between 2865 and 2835 cm
À1 .
(c) Invert the spectrum, by multiplication by À1.
(d) Normalize this region, such that the peak around
2850 cm
À1 is normalized to 1.
(e) Determine the peak position as the midpoint of the horizontal line that intersects at 80% of the peak height, and
save it.
(f) Steps (a) through (e) need to be applied to all the spectra
that have been recorded during the run.
2. In a spreadsheet program, enter column listing: (1) spectrum
number, (2) time point of collection and/or sample temperature during collection, and (3) symmetric CH 2 stretching band
position (νCH 2 ). Create a plot in which νCH 2 is plotted as a
function of the time point of spectra acquisition or temperature
of the sample (see Note 16). First derivative analysis can be used
to resolve phase transitions more clearly.
3.7 Spectral
Analysis: Water-to-Ice
Phase Transition
The water-to-ice or ice-to-water phase transition can be studied by
following the change in the position and shape of the H 2 O-libration and H 2 O-bending combination band around 2200 cm
À1 in
FTIR spectra acquired during cooling or heating of a sample (see
Fig. 6a):
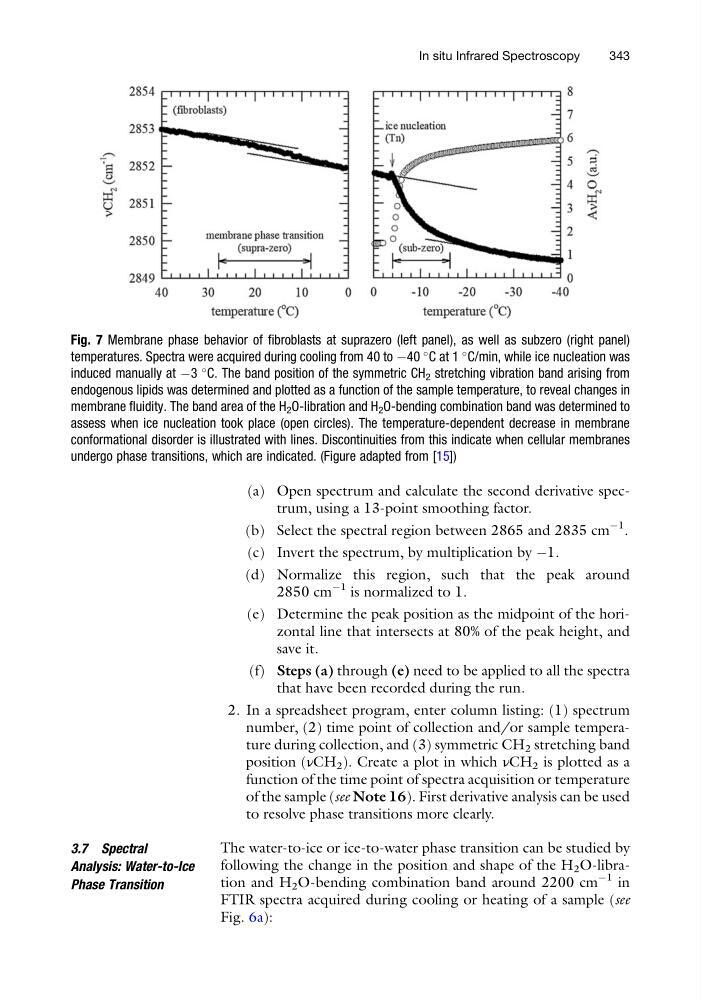
Fig. 7 Membrane phase behavior of fibroblasts at suprazero (left panel), as well as subzero (right panel)
temperatures. Spectra were acquired during cooling from 40 to À40
C at 1
C/min, while ice nucleation was
induced manually at À3
C. The band position of the symmetric CH 2 stretching vibration band arising from
endogenous lipids was determined and plotted as a function of the sample temperature, to reveal changes in
membrane fluidity. The band area of the H 2 O-libration and H 2 O-bending combination band was determined to
assess when ice nucleation took place (open circles). The temperature-dependent decrease in membrane
conformational disorder is illustrated with lines. Discontinuities from this indicate when cellular membranes
undergo phase transitions, which are indicated. (Figure adapted from [15])
In situ Infrared Spectroscopy
343
(b) Select the spectral region between 2865 and 2835 cm
À1 .
(c) Invert the spectrum, by multiplication by À1.
(d) Normalize this region, such that the peak around
2850 cm
À1 is normalized to 1.
(e) Determine the peak position as the midpoint of the horizontal line that intersects at 80% of the peak height, and
save it.
(f) Steps (a) through (e) need to be applied to all the spectra
that have been recorded during the run.
2. In a spreadsheet program, enter column listing: (1) spectrum
number, (2) time point of collection and/or sample temperature during collection, and (3) symmetric CH 2 stretching band
position (νCH 2 ). Create a plot in which νCH 2 is plotted as a
function of the time point of spectra acquisition or temperature
of the sample (see Note 16). First derivative analysis can be used
to resolve phase transitions more clearly.
3.7 Spectral
Analysis: Water-to-Ice
Phase Transition
The water-to-ice or ice-to-water phase transition can be studied by
following the change in the position and shape of the H 2 O-libration and H 2 O-bending combination band around 2200 cm
À1 in
FTIR spectra acquired during cooling or heating of a sample (see
Fig. 6a):
Fig. 7 Membrane phase behavior of fibroblasts at suprazero (left panel), as well as subzero (right panel)
temperatures. Spectra were acquired during cooling from 40 to À40
C at 1
C/min, while ice nucleation was
induced manually at À3
C. The band position of the symmetric CH 2 stretching vibration band arising from
endogenous lipids was determined and plotted as a function of the sample temperature, to reveal changes in
membrane fluidity. The band area of the H 2 O-libration and H 2 O-bending combination band was determined to
assess when ice nucleation took place (open circles). The temperature-dependent decrease in membrane
conformational disorder is illustrated with lines. Discontinuities from this indicate when cellular membranes
undergo phase transitions, which are indicated. (Figure adapted from [15])
In situ Infrared Spectroscopy
343