

3. In a spreadsheet program, enter column listing: (1) spectrum
number, (2) time point of collection, and (3) band area (A t ).
For mixtures, list band areas for the respective components in
separate columns. Create a plot in which A t is plotted as a
function of the time point of spectra acquisition.
4. For fitting purposes, create a plot in which normalized absorbance values are plotted versus time. Do so by dividing absorbance values at a given time point (A t ) by the absorbance at
equilibrium (A 1 ; as collected at the end of the spectral run).
5. The diffusion process can be modeled using Fick’s law of
diffusion for a one-dimensional flow into a film. Fit the absorbance at a given time point (A t ) normalized toward the absorbance at equilibrium (A 1 ) using the following equation (e.g.,
using MATLAB software):
A t
A 1
¼ 1 À
8γ
π 1À exp À2γL
ð
Þ
ð
Þ
P 1
n¼0
exp À
D 2nþ1
ð
Þ
2 π
2 t
4L
2
À1
ð Þ
n 2γ þ
2nþ1
ð
Þ π
2L
exp À2γL
ð
Þ
h
i
2n þ 1
ð
Þ 4γ 2 þ
2nþ1
ð
Þ π
2L
2
ð1Þ
where L is the thickness or height of the tissue (in cm; keep
in mind that the tissue is exposed from one side), t is time (in s),
and D is the diffusion coefficient (in cm
2 /s). γ is the evanescent
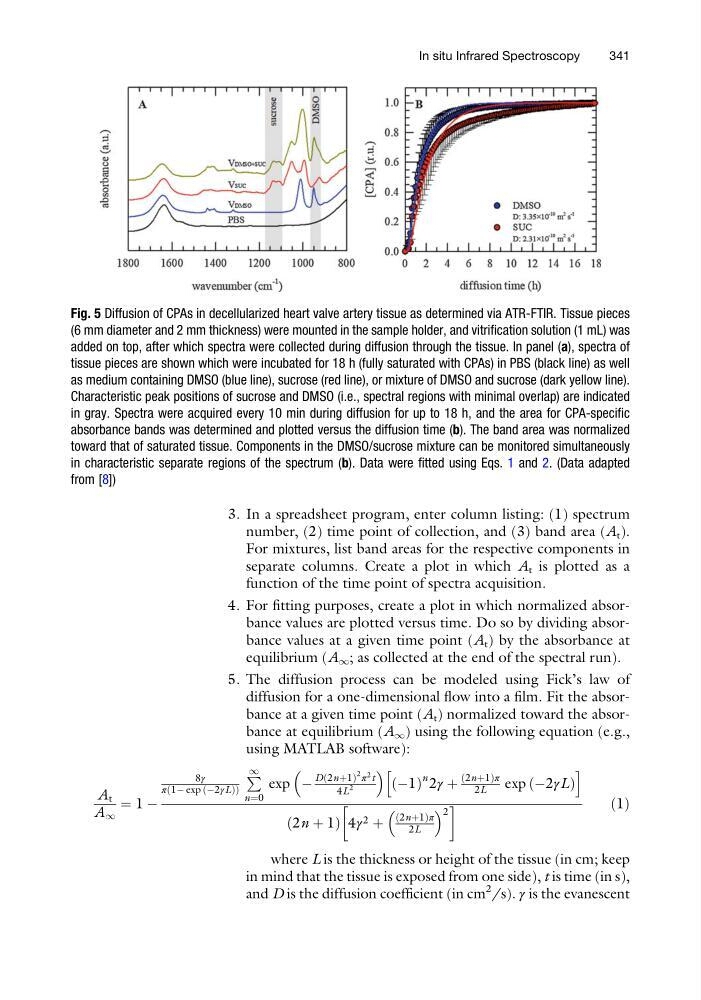
Fig. 5 Diffusion of CPAs in decellularized heart valve artery tissue as determined via ATR-FTIR. Tissue pieces
(6 mm diameter and 2 mm thickness) were mounted in the sample holder, and vitrification solution (1 mL) was
added on top, after which spectra were collected during diffusion through the tissue. In panel (a), spectra of
tissue pieces are shown which were incubated for 18 h (fully saturated with CPAs) in PBS (black line) as well
as medium containing DMSO (blue line), sucrose (red line), or mixture of DMSO and sucrose (dark yellow line).
Characteristic peak positions of sucrose and DMSO (i.e., spectral regions with minimal overlap) are indicated
in gray. Spectra were acquired every 10 min during diffusion for up to 18 h, and the area for CPA-specific
absorbance bands was determined and plotted versus the diffusion time (b). The band area was normalized
toward that of saturated tissue. Components in the DMSO/sucrose mixture can be monitored simultaneously
in characteristic separate regions of the spectrum (b). Data were fitted using Eqs. 1 and 2. (Data adapted
from [8])
In situ Infrared Spectroscopy
341
number, (2) time point of collection, and (3) band area (A t ).
For mixtures, list band areas for the respective components in
separate columns. Create a plot in which A t is plotted as a
function of the time point of spectra acquisition.
4. For fitting purposes, create a plot in which normalized absorbance values are plotted versus time. Do so by dividing absorbance values at a given time point (A t ) by the absorbance at
equilibrium (A 1 ; as collected at the end of the spectral run).
5. The diffusion process can be modeled using Fick’s law of
diffusion for a one-dimensional flow into a film. Fit the absorbance at a given time point (A t ) normalized toward the absorbance at equilibrium (A 1 ) using the following equation (e.g.,
using MATLAB software):
A t
A 1
¼ 1 À
8γ
π 1À exp À2γL
ð
Þ
ð
Þ
P 1
n¼0
exp À
D 2nþ1
ð
Þ
2 π
2 t
4L
2
À1
ð Þ
n 2γ þ
2nþ1
ð
Þ π
2L
exp À2γL
ð
Þ
h
i
2n þ 1
ð
Þ 4γ 2 þ
2nþ1
ð
Þ π
2L
2
ð1Þ
where L is the thickness or height of the tissue (in cm; keep
in mind that the tissue is exposed from one side), t is time (in s),
and D is the diffusion coefficient (in cm
2 /s). γ is the evanescent
Fig. 5 Diffusion of CPAs in decellularized heart valve artery tissue as determined via ATR-FTIR. Tissue pieces
(6 mm diameter and 2 mm thickness) were mounted in the sample holder, and vitrification solution (1 mL) was
added on top, after which spectra were collected during diffusion through the tissue. In panel (a), spectra of
tissue pieces are shown which were incubated for 18 h (fully saturated with CPAs) in PBS (black line) as well
as medium containing DMSO (blue line), sucrose (red line), or mixture of DMSO and sucrose (dark yellow line).
Characteristic peak positions of sucrose and DMSO (i.e., spectral regions with minimal overlap) are indicated
in gray. Spectra were acquired every 10 min during diffusion for up to 18 h, and the area for CPA-specific
absorbance bands was determined and plotted versus the diffusion time (b). The band area was normalized
toward that of saturated tissue. Components in the DMSO/sucrose mixture can be monitored simultaneously
in characteristic separate regions of the spectrum (b). Data were fitted using Eqs. 1 and 2. (Data adapted
from [8])
In situ Infrared Spectroscopy
341