

spreadsheet (e.g., Excel). If you are also interested in the
Me 2 SO concentration range within the sample, you can also
select and copy the minimum and maximum attenuation within
the VOI.
3. Repeat the steps 1–2 for each sample. Remember the option of
opening the first VOI created, and replace it in the new sample.
It is recommended to use the same size and shape of VOIs for
similar samples.
4. To calculate the Me 2 SO concentration (% v/v), use the calibration curve obtained in Subheading 3.1 at RT, in the case of
rewarmed samples, or the one obtained in Subheading 3.2 at
À140
C, for the cryopreserved samples. Introduce the average
attenuation (HU) of the VOI in the equation of the calibration
curve to obtain the Me 2 SO concentration:
Me 2 SO
½
¼a∗HU þ b
Do the same to calculate the minimum and maximum
Me 2 SO concentration of the samples. See an example of
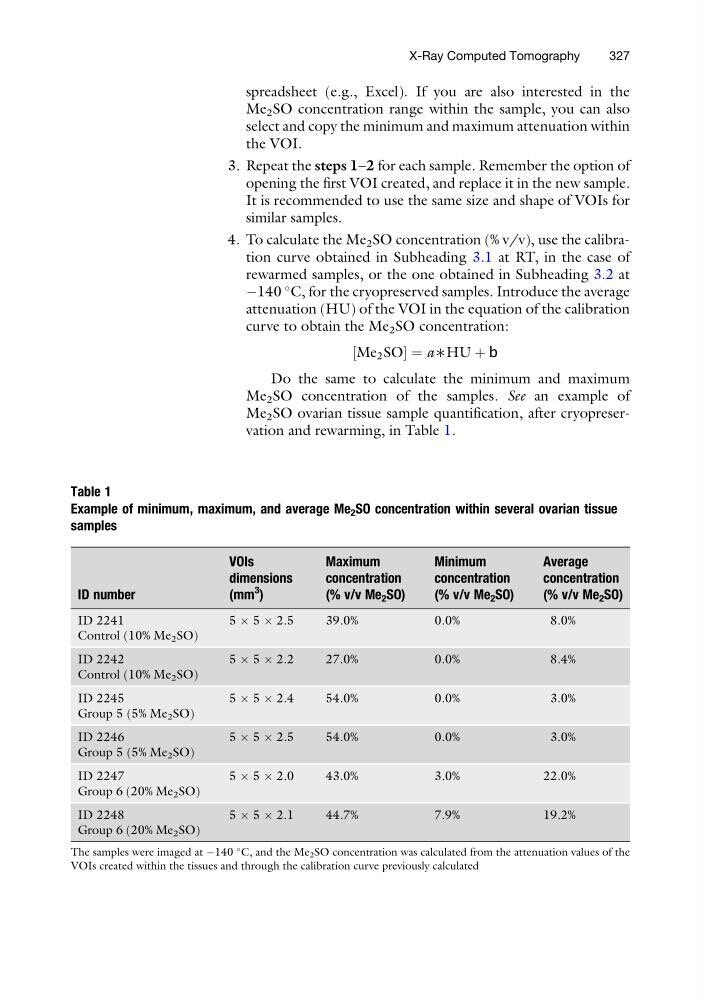
Me 2 SO ovarian tissue sample quantification, after cryopreservation and rewarming, in Table 1.
Table 1
Example of minimum, maximum, and average Me 2 SO concentration within several ovarian tissue
samples
ID number
VOIs
dimensions
(mm
3
)
Maximum
concentration
(% v/v Me 2 SO)
Minimum
concentration
(% v/v Me 2 SO)
Average
concentration
(% v/v Me 2 SO)
ID 2241
Control (10% Me 2 SO)
5 Â 5 Â 2.5
39.0%
0.0%
8.0%
ID 2242
Control (10% Me 2 SO)
5 Â 5 Â 2.2
27.0%
0.0%
8.4%
ID 2245
Group 5 (5% Me 2 SO)
5 Â 5 Â 2.4
54.0%
0.0%
3.0%
ID 2246
Group 5 (5% Me 2 SO)
5 Â 5 Â 2.5
54.0%
0.0%
3.0%
ID 2247
Group 6 (20% Me 2 SO)
5 Â 5 Â 2.0
43.0%
3.0%
22.0%
ID 2248
Group 6 (20% Me 2 SO)
5 Â 5 Â 2.1
44.7%
7.9%
19.2%
The samples were imaged at À140
C, and the Me 2 SO concentration was calculated from the attenuation values of the
VOIs created within the tissues and through the calibration curve previously calculated
X-Ray Computed Tomography
327
Me 2 SO concentration range within the sample, you can also
select and copy the minimum and maximum attenuation within
the VOI.
3. Repeat the steps 1–2 for each sample. Remember the option of
opening the first VOI created, and replace it in the new sample.
It is recommended to use the same size and shape of VOIs for
similar samples.
4. To calculate the Me 2 SO concentration (% v/v), use the calibration curve obtained in Subheading 3.1 at RT, in the case of
rewarmed samples, or the one obtained in Subheading 3.2 at
À140
C, for the cryopreserved samples. Introduce the average
attenuation (HU) of the VOI in the equation of the calibration
curve to obtain the Me 2 SO concentration:
Me 2 SO
½
¼a∗HU þ b
Do the same to calculate the minimum and maximum
Me 2 SO concentration of the samples. See an example of
Me 2 SO ovarian tissue sample quantification, after cryopreservation and rewarming, in Table 1.
Table 1
Example of minimum, maximum, and average Me 2 SO concentration within several ovarian tissue
samples
ID number
VOIs
dimensions
(mm
3
)
Maximum
concentration
(% v/v Me 2 SO)
Minimum
concentration
(% v/v Me 2 SO)
Average
concentration
(% v/v Me 2 SO)
ID 2241
Control (10% Me 2 SO)
5 Â 5 Â 2.5
39.0%
0.0%
8.0%
ID 2242
Control (10% Me 2 SO)
5 Â 5 Â 2.2
27.0%
0.0%
8.4%
ID 2245
Group 5 (5% Me 2 SO)
5 Â 5 Â 2.4
54.0%
0.0%
3.0%
ID 2246
Group 5 (5% Me 2 SO)
5 Â 5 Â 2.5
54.0%
0.0%
3.0%
ID 2247
Group 6 (20% Me 2 SO)
5 Â 5 Â 2.0
43.0%
3.0%
22.0%
ID 2248
Group 6 (20% Me 2 SO)
5 Â 5 Â 2.1
44.7%
7.9%
19.2%
The samples were imaged at À140
C, and the Me 2 SO concentration was calculated from the attenuation values of the
VOIs created within the tissues and through the calibration curve previously calculated
X-Ray Computed Tomography
327