

CT. For a better accurate washing analysis, it is recommended
to consider the time of the image acquisition in the last
washing step.
3. Repeat the steps 3–7 of Subheading 3.1.
3.5 Quantification of
Me 2 SO Concentration
in the Biological
Samples
1. Open the analysis software, and select first CT image of the
sample to analyze. Select the color scale that allows you to
visualize better the different concentrations (see Note 10).
Use the specific tool of the analysis to transform the CT values
to the standard units Hounsfield units (HU), according to the
following equation:
HU ¼ 1000 Â
CT sample À CT water
CT water À CT air
where HU is the X-ray attenuation in HU and CT in the raw
units of the CT device (CT values). Insert the average CT
values obtained for water at the step 8 of Subheading 3.1 for
CT water , and use 0 for the CT value of air (CT air ). Save the
image in Hounsfield units.
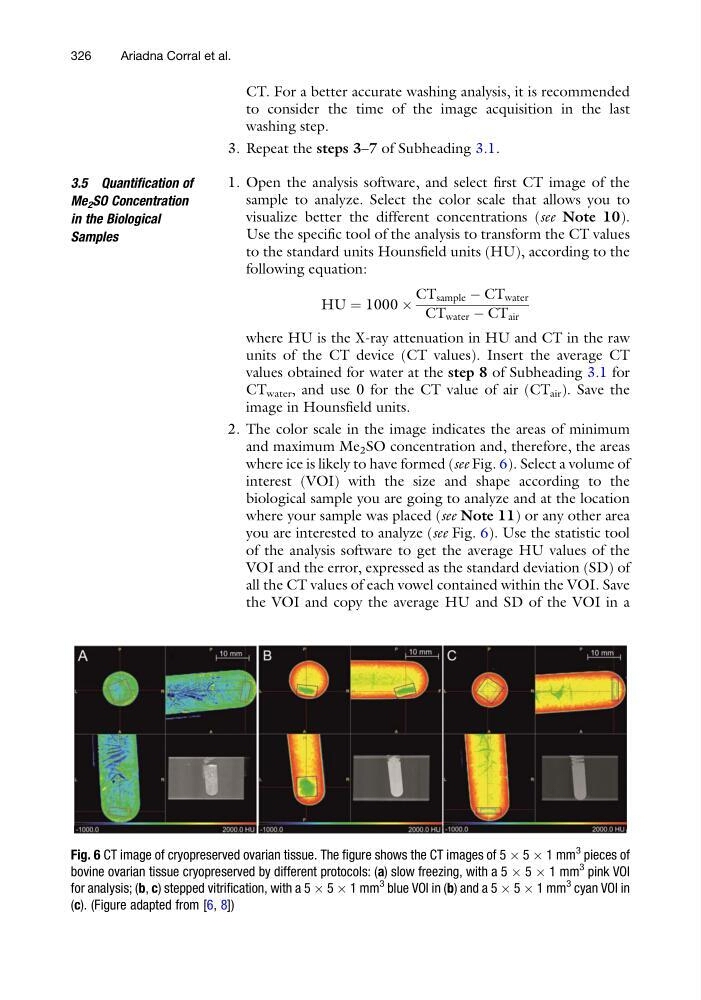
2. The color scale in the image indicates the areas of minimum
and maximum Me 2 SO concentration and, therefore, the areas
where ice is likely to have formed (see Fig. 6). Select a volume of
interest (VOI) with the size and shape according to the
biological sample you are going to analyze and at the location
where your sample was placed (see Note 11) or any other area
you are interested to analyze (see Fig. 6). Use the statistic tool
of the analysis software to get the average HU values of the
VOI and the error, expressed as the standard deviation (SD) of
all the CT values of each vowel contained within the VOI. Save
the VOI and copy the average HU and SD of the VOI in a
Fig. 6 CT image of cryopreserved ovarian tissue. The figure shows the CT images of 5 Â 5 Â 1 mm
3 pieces of
bovine ovarian tissue cryopreserved by different protocols: (a) slow freezing, with a 5 Â 5 Â 1 mm
3 pink VOI
for analysis; (b, c) stepped vitrification, with a 5 Â 5 Â 1 mm
3 blue VOI in (b) and a 5 Â 5 Â 1 mm
3 cyan VOI in
(c). (Figure adapted from [6, 8])
326
Ariadna Corral et al.
to consider the time of the image acquisition in the last
washing step.
3. Repeat the steps 3–7 of Subheading 3.1.
3.5 Quantification of
Me 2 SO Concentration
in the Biological
Samples
1. Open the analysis software, and select first CT image of the
sample to analyze. Select the color scale that allows you to
visualize better the different concentrations (see Note 10).
Use the specific tool of the analysis to transform the CT values
to the standard units Hounsfield units (HU), according to the
following equation:
HU ¼ 1000 Â
CT sample À CT water
CT water À CT air
where HU is the X-ray attenuation in HU and CT in the raw
units of the CT device (CT values). Insert the average CT
values obtained for water at the step 8 of Subheading 3.1 for
CT water , and use 0 for the CT value of air (CT air ). Save the
image in Hounsfield units.
2. The color scale in the image indicates the areas of minimum
and maximum Me 2 SO concentration and, therefore, the areas
where ice is likely to have formed (see Fig. 6). Select a volume of
interest (VOI) with the size and shape according to the
biological sample you are going to analyze and at the location
where your sample was placed (see Note 11) or any other area
you are interested to analyze (see Fig. 6). Use the statistic tool
of the analysis software to get the average HU values of the
VOI and the error, expressed as the standard deviation (SD) of
all the CT values of each vowel contained within the VOI. Save
the VOI and copy the average HU and SD of the VOI in a
Fig. 6 CT image of cryopreserved ovarian tissue. The figure shows the CT images of 5 Â 5 Â 1 mm
3 pieces of
bovine ovarian tissue cryopreserved by different protocols: (a) slow freezing, with a 5 Â 5 Â 1 mm
3 pink VOI
for analysis; (b, c) stepped vitrification, with a 5 Â 5 Â 1 mm
3 blue VOI in (b) and a 5 Â 5 Â 1 mm
3 cyan VOI in
(c). (Figure adapted from [6, 8])
326
Ariadna Corral et al.