

temperature and chamber pressure low enough so that the sample
temperature will not exceed T
0
g or T e (whichever is lower) during
primary drying. The collapse temperature of the frozen samples
during freeze-drying can be determined by DSC indirectly (see
Note 6). The collapse temperature is typically 5–10
C above T
0
g
or T e [3].
T
0
g and T e are dependent on the scanning rate of the measurement, and both cooling rate and warming rate will affect the T
0
g and
T e values. In order to accurately measure the T
0
g and T e of the
maximally freeze-concentrated sample for the development of a
freeze-drying protocol, the cooling and warming rates must be
kept slow, typically at the range of 0.5–2
C per min and 2–5
C
per min, respectively.
An example for measuring the T
0
g of a solution is given in
Fig. 3. The change in heat capacity associated with glass transition
is small, is often accompanied by an endothermic relaxation, and
can be mistaken for a melting transition. For structured materials
such as tissues, the measurement of T
0
g is tricky. Figure 6 shows a
warming thermogram of decellularized human tendon tissue after
the tissue is preincubated in a 10% maltodextrin solution. During
the incubation, the protectant will enter into the tissue’s interstitial
space, and upon freezing, there are solid tissue matrix domains with
unfrozen water, ice, and the freeze-concentrated amorphous protectant domain in the tissue’s interstitial space. The sample was
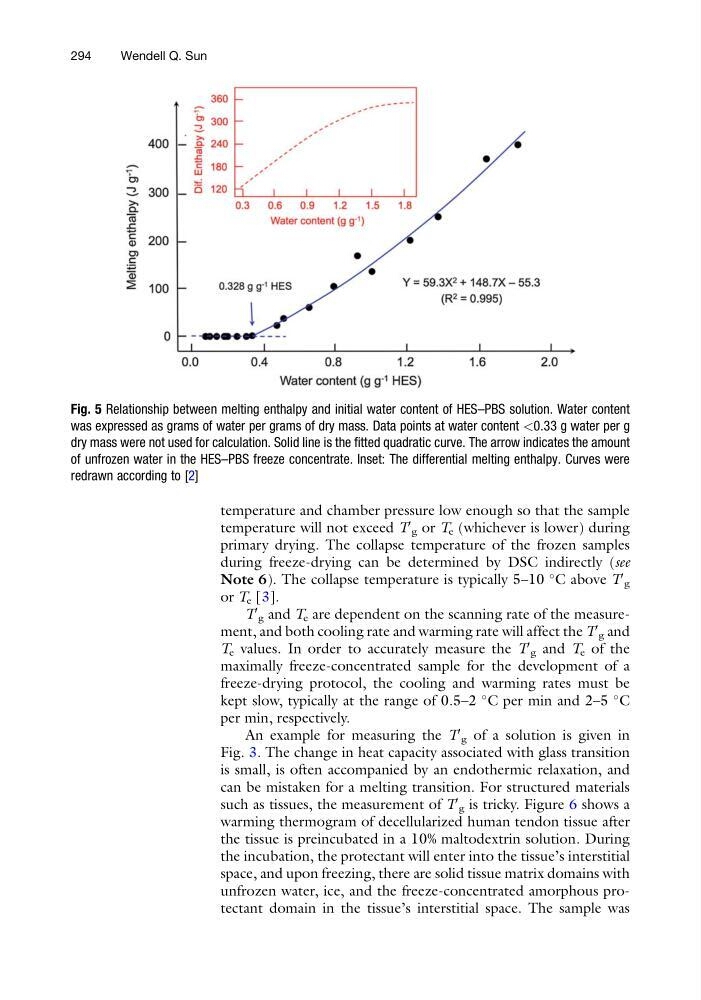
Fig. 5 Relationship between melting enthalpy and initial water content of HES–PBS solution. Water content
was expressed as grams of water per grams of dry mass. Data points at water content <0.33 g water per g
dry mass were not used for calculation. Solid line is the fitted quadratic curve. The arrow indicates the amount
of unfrozen water in the HES–PBS freeze concentrate. Inset: The differential melting enthalpy. Curves were
redrawn according to [2]
294
Wendell Q. Sun
temperature will not exceed T
0
g or T e (whichever is lower) during
primary drying. The collapse temperature of the frozen samples
during freeze-drying can be determined by DSC indirectly (see
Note 6). The collapse temperature is typically 5–10
C above T
0
g
or T e [3].
T
0
g and T e are dependent on the scanning rate of the measurement, and both cooling rate and warming rate will affect the T
0
g and
T e values. In order to accurately measure the T
0
g and T e of the
maximally freeze-concentrated sample for the development of a
freeze-drying protocol, the cooling and warming rates must be
kept slow, typically at the range of 0.5–2
C per min and 2–5
C
per min, respectively.
An example for measuring the T
0
g of a solution is given in
Fig. 3. The change in heat capacity associated with glass transition
is small, is often accompanied by an endothermic relaxation, and
can be mistaken for a melting transition. For structured materials
such as tissues, the measurement of T
0
g is tricky. Figure 6 shows a
warming thermogram of decellularized human tendon tissue after
the tissue is preincubated in a 10% maltodextrin solution. During
the incubation, the protectant will enter into the tissue’s interstitial
space, and upon freezing, there are solid tissue matrix domains with
unfrozen water, ice, and the freeze-concentrated amorphous protectant domain in the tissue’s interstitial space. The sample was
Fig. 5 Relationship between melting enthalpy and initial water content of HES–PBS solution. Water content
was expressed as grams of water per grams of dry mass. Data points at water content <0.33 g water per g
dry mass were not used for calculation. Solid line is the fitted quadratic curve. The arrow indicates the amount
of unfrozen water in the HES–PBS freeze concentrate. Inset: The differential melting enthalpy. Curves were
redrawn according to [2]
294
Wendell Q. Sun